I'm passionate about building world-class data analytics and visualization products to enhance user understanding and decision-making.
As a senior software engineer at Reddit, I work on the frontend development of the experimentation platform, building scalable tools that enable developers to run high-impact experiments and rollouts across Reddit with speed and confidence.
My expertise spans both the tech and journalism sectors. In tech, I previously worked as a staff design engineer at Visa, and a software engineer at Splunk, leading the development of scalable design system, and building interactive tools to help businesses monitor large data infrastructures efficiently.
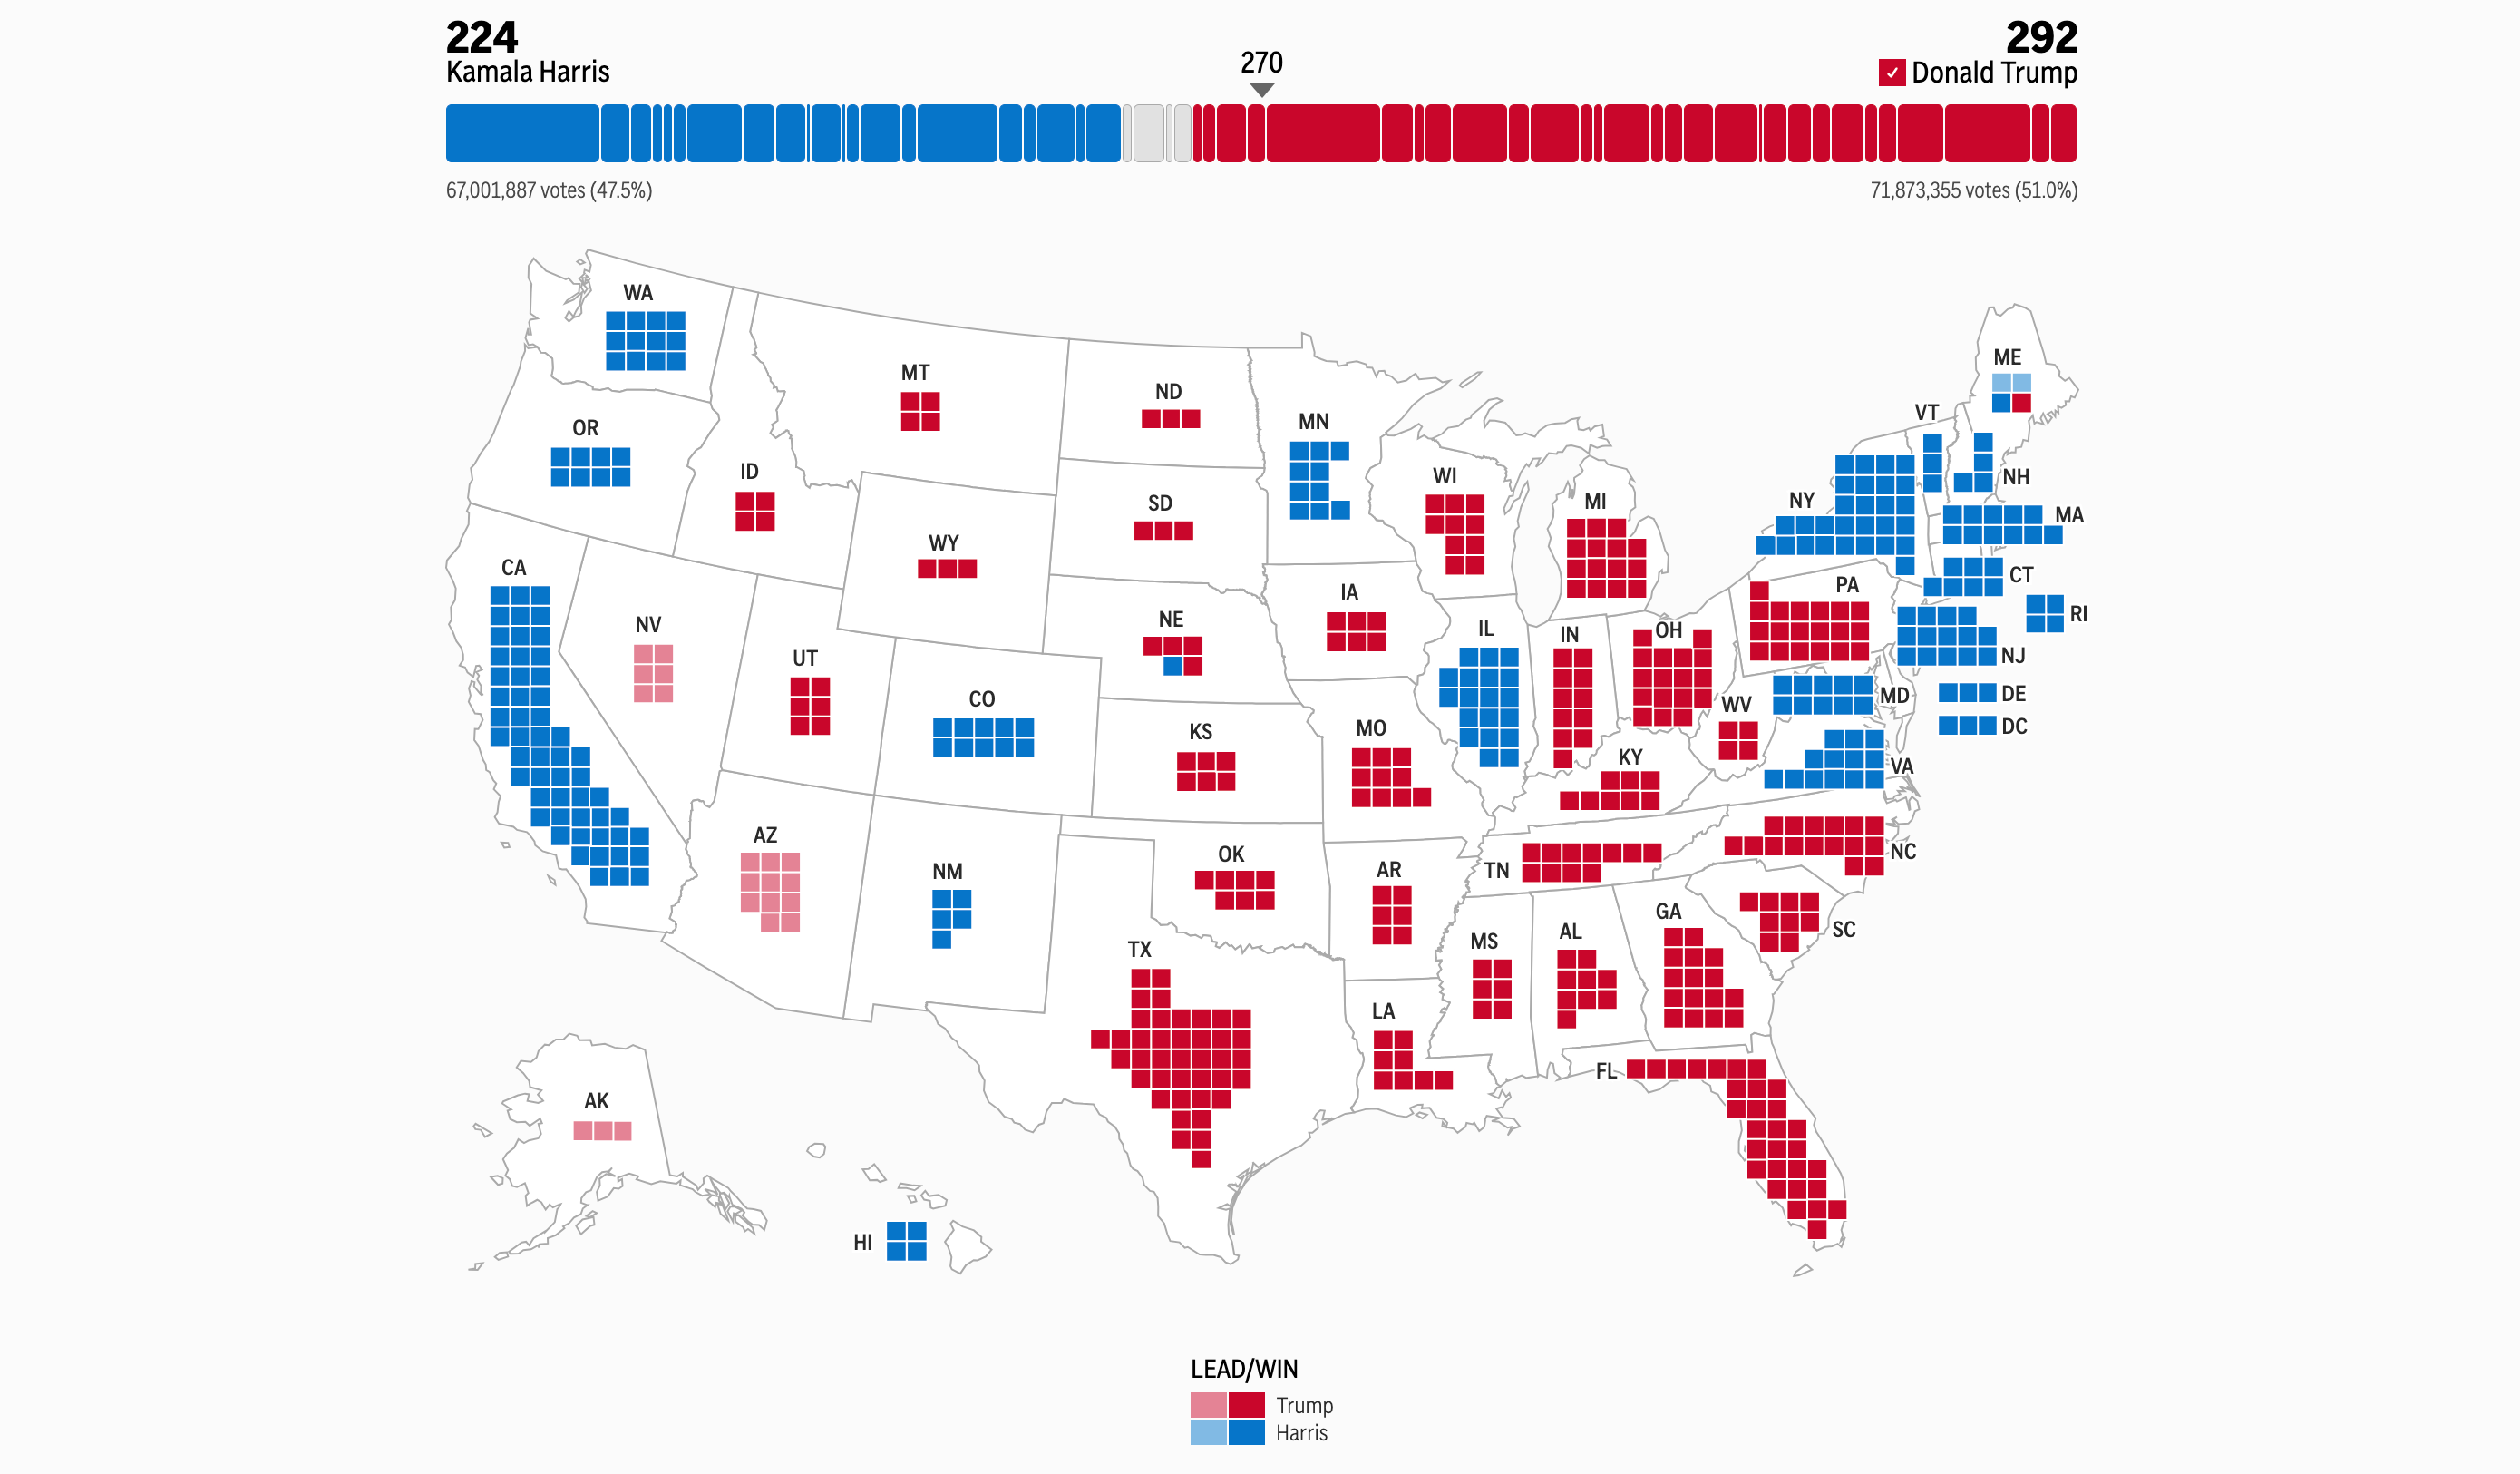
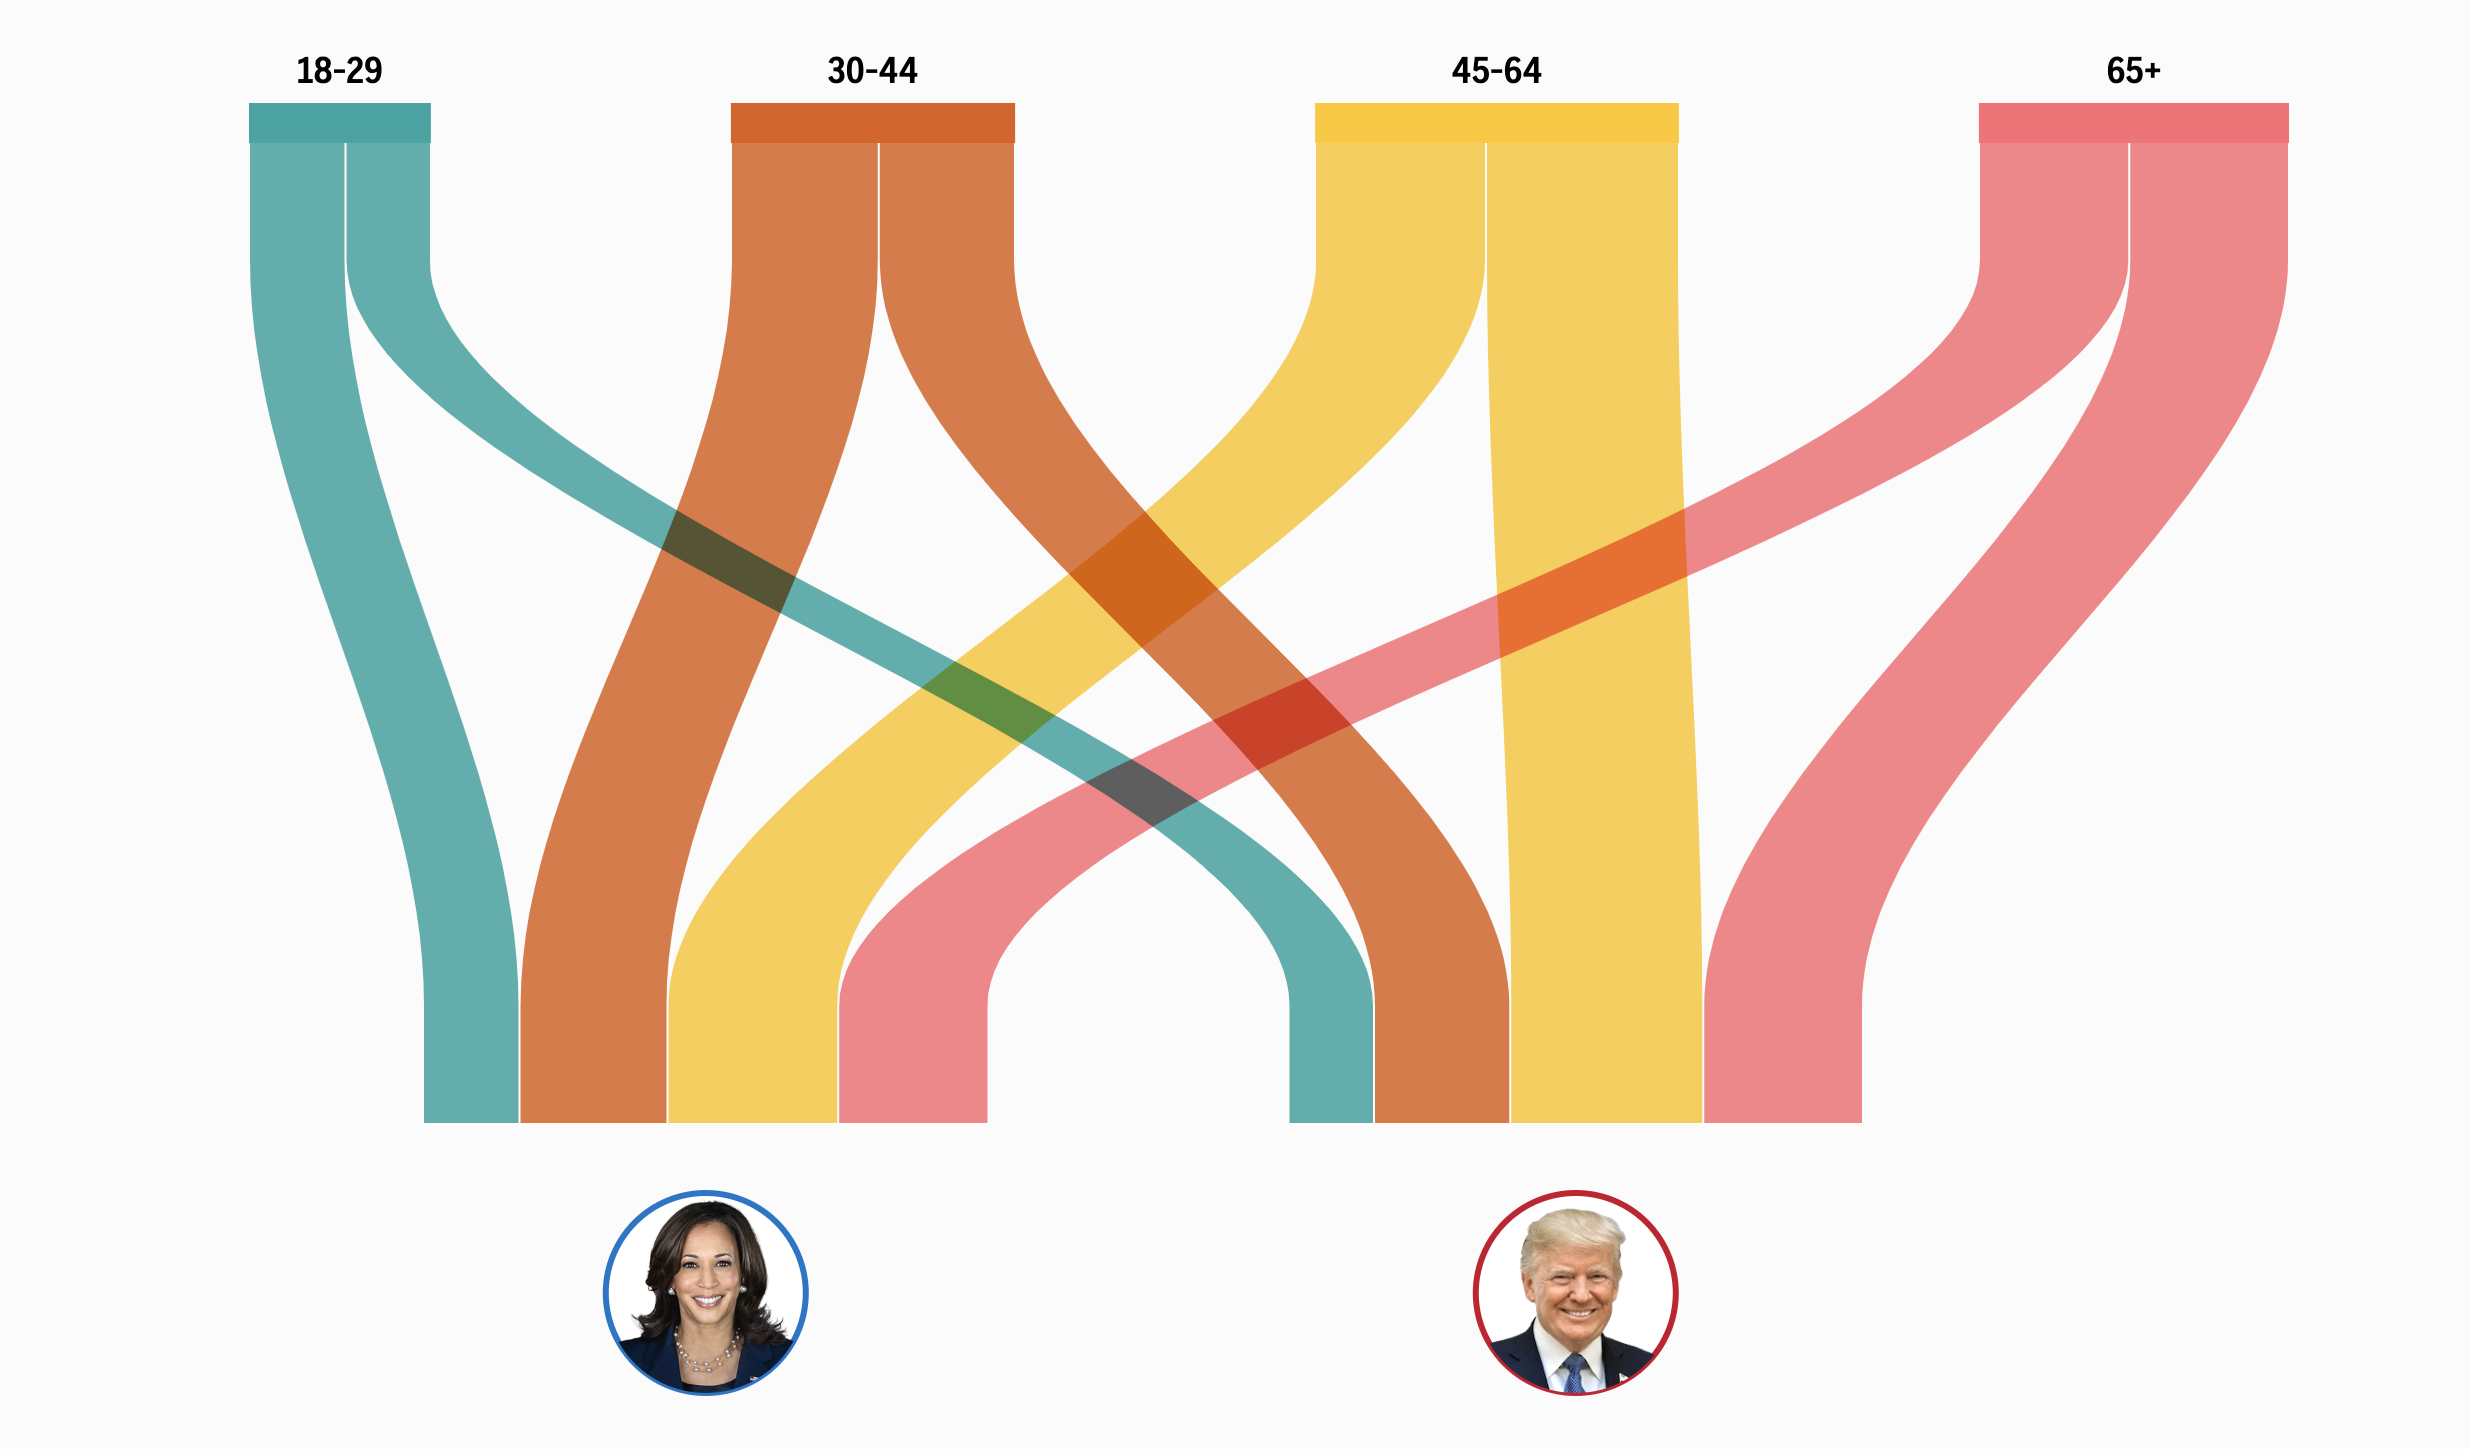
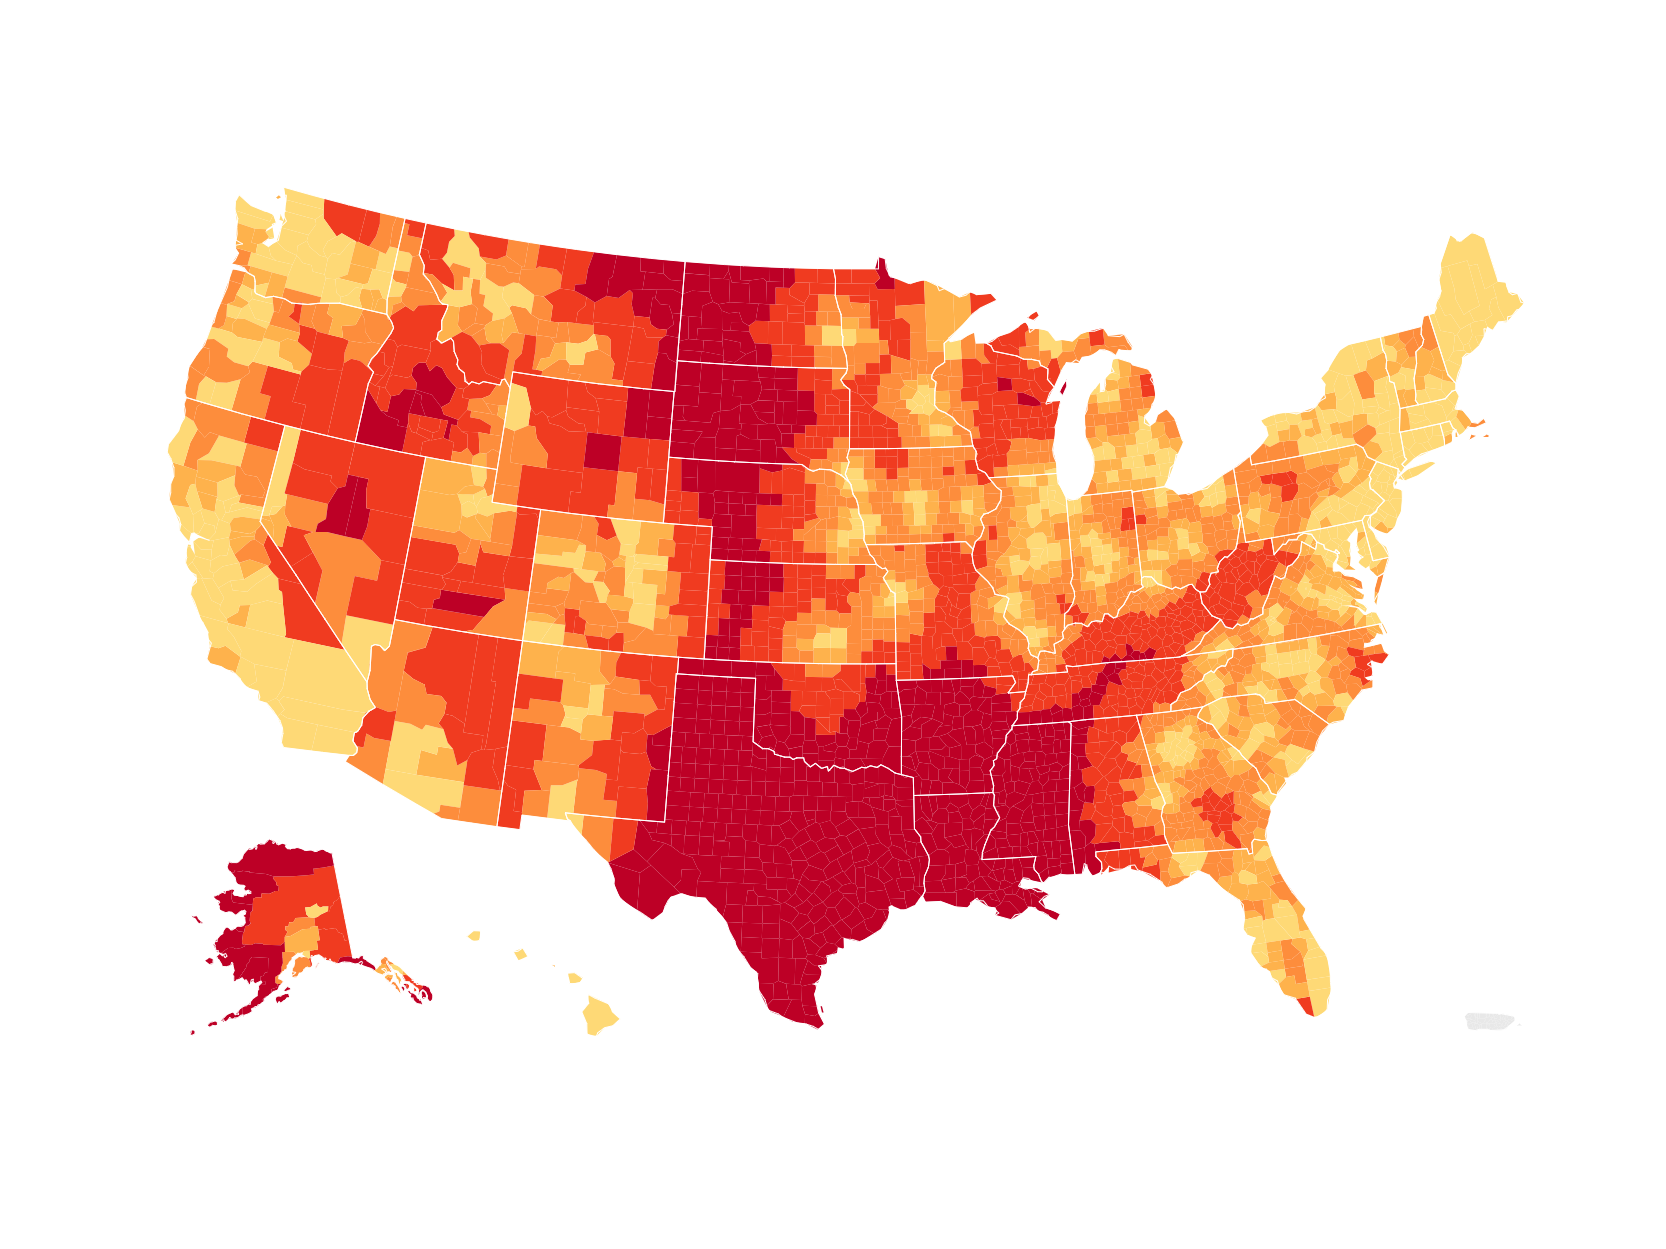
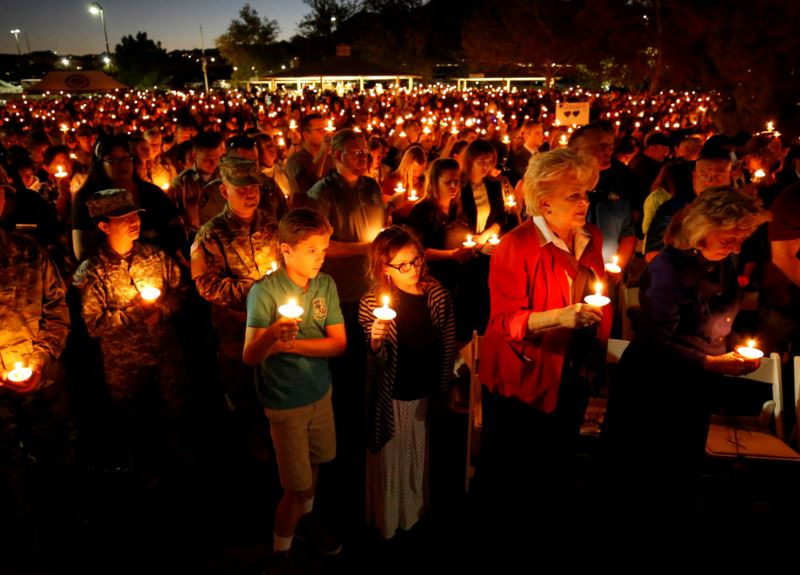
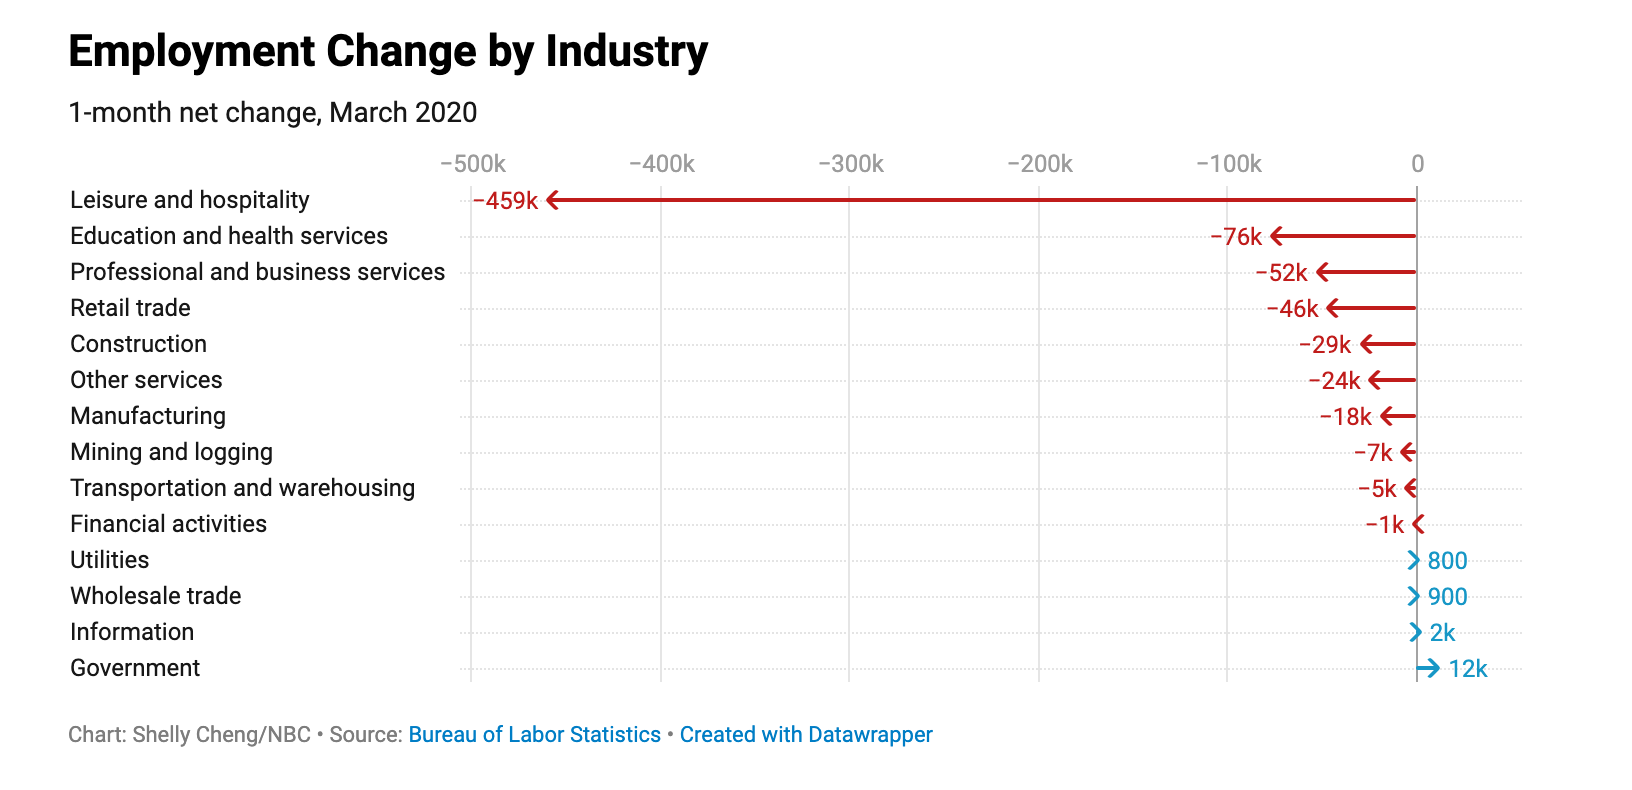
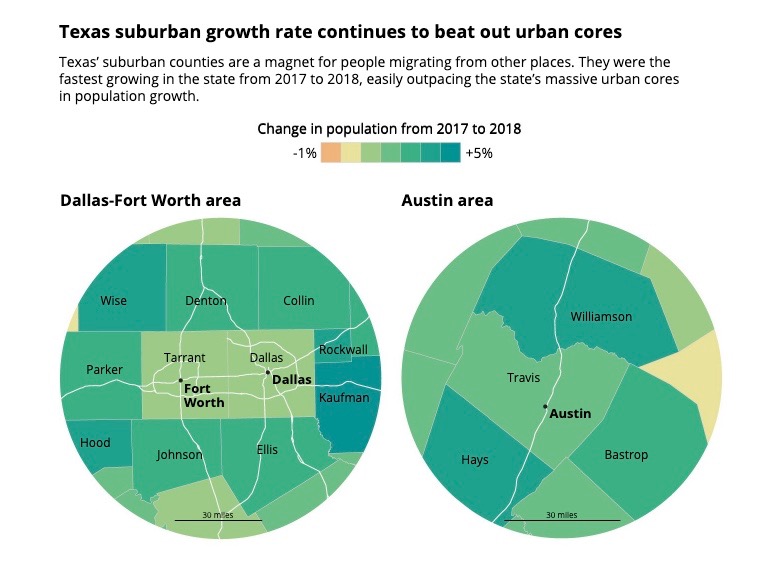
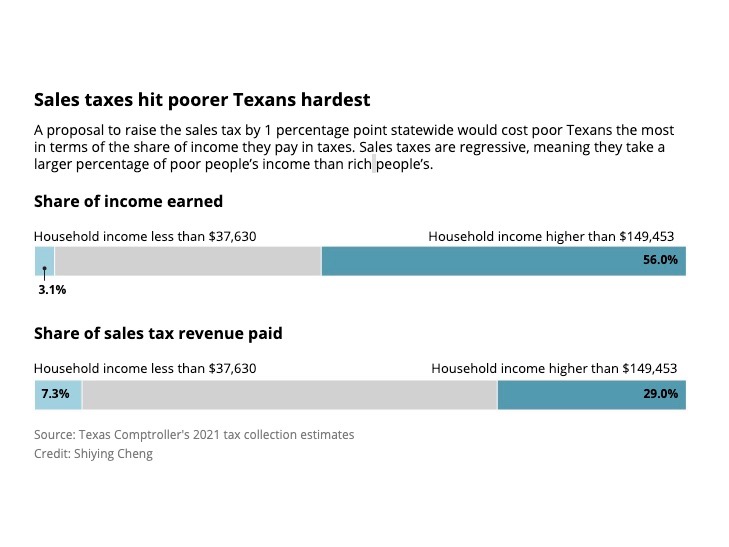
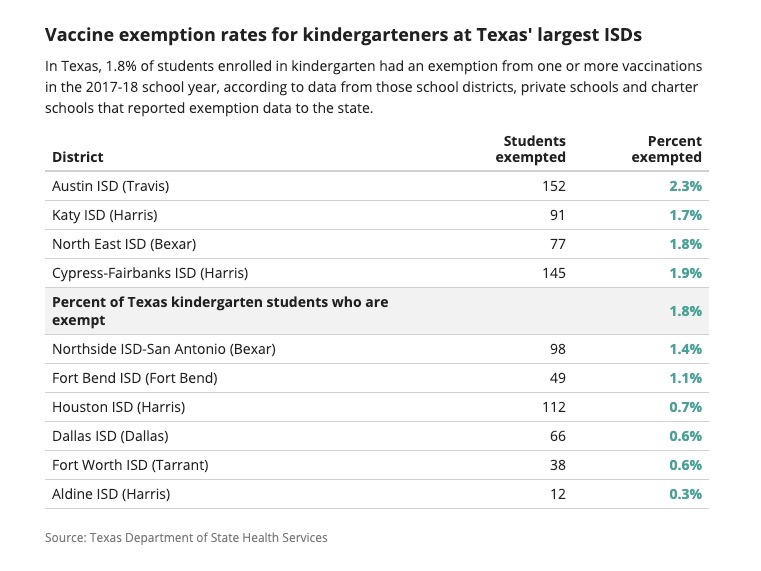
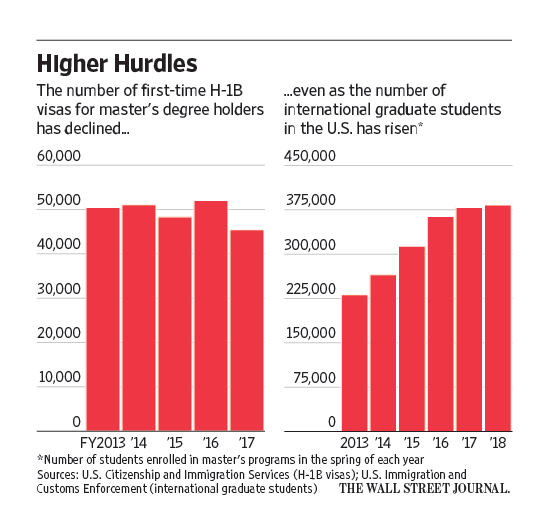
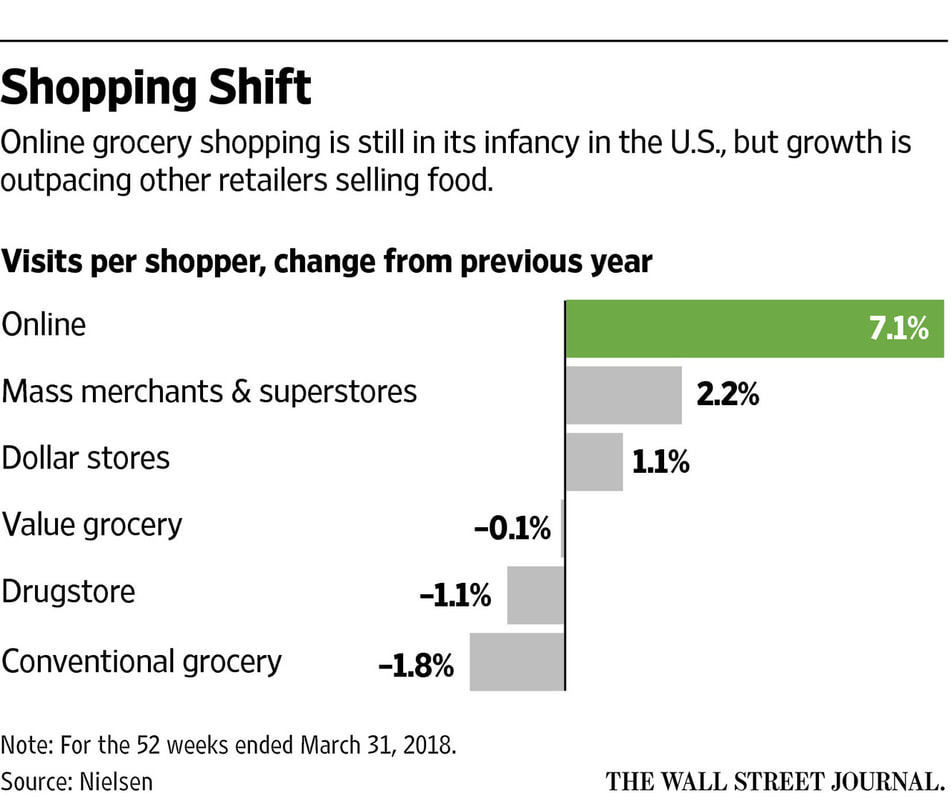
In journalism, I've served as a data visualization developer / graphics reporter at esteemed newsrooms, including The Wall Street Journal, The Associated Press, and NBC. I collaborated with reporters and editors to tell data-driven, visual stories on various topics, such as U.S. national and local elections, high-profile companies in business, and the impact of COVID-19.
My research paper on how captions affect visualization reading has been presented at IEEE Visualization Conference 2022 .
My visualization work has won awards from the European Journalism Centre, The Society of American Business Editors and Writers, The Society for News Design and Texas Medical Association, among others.