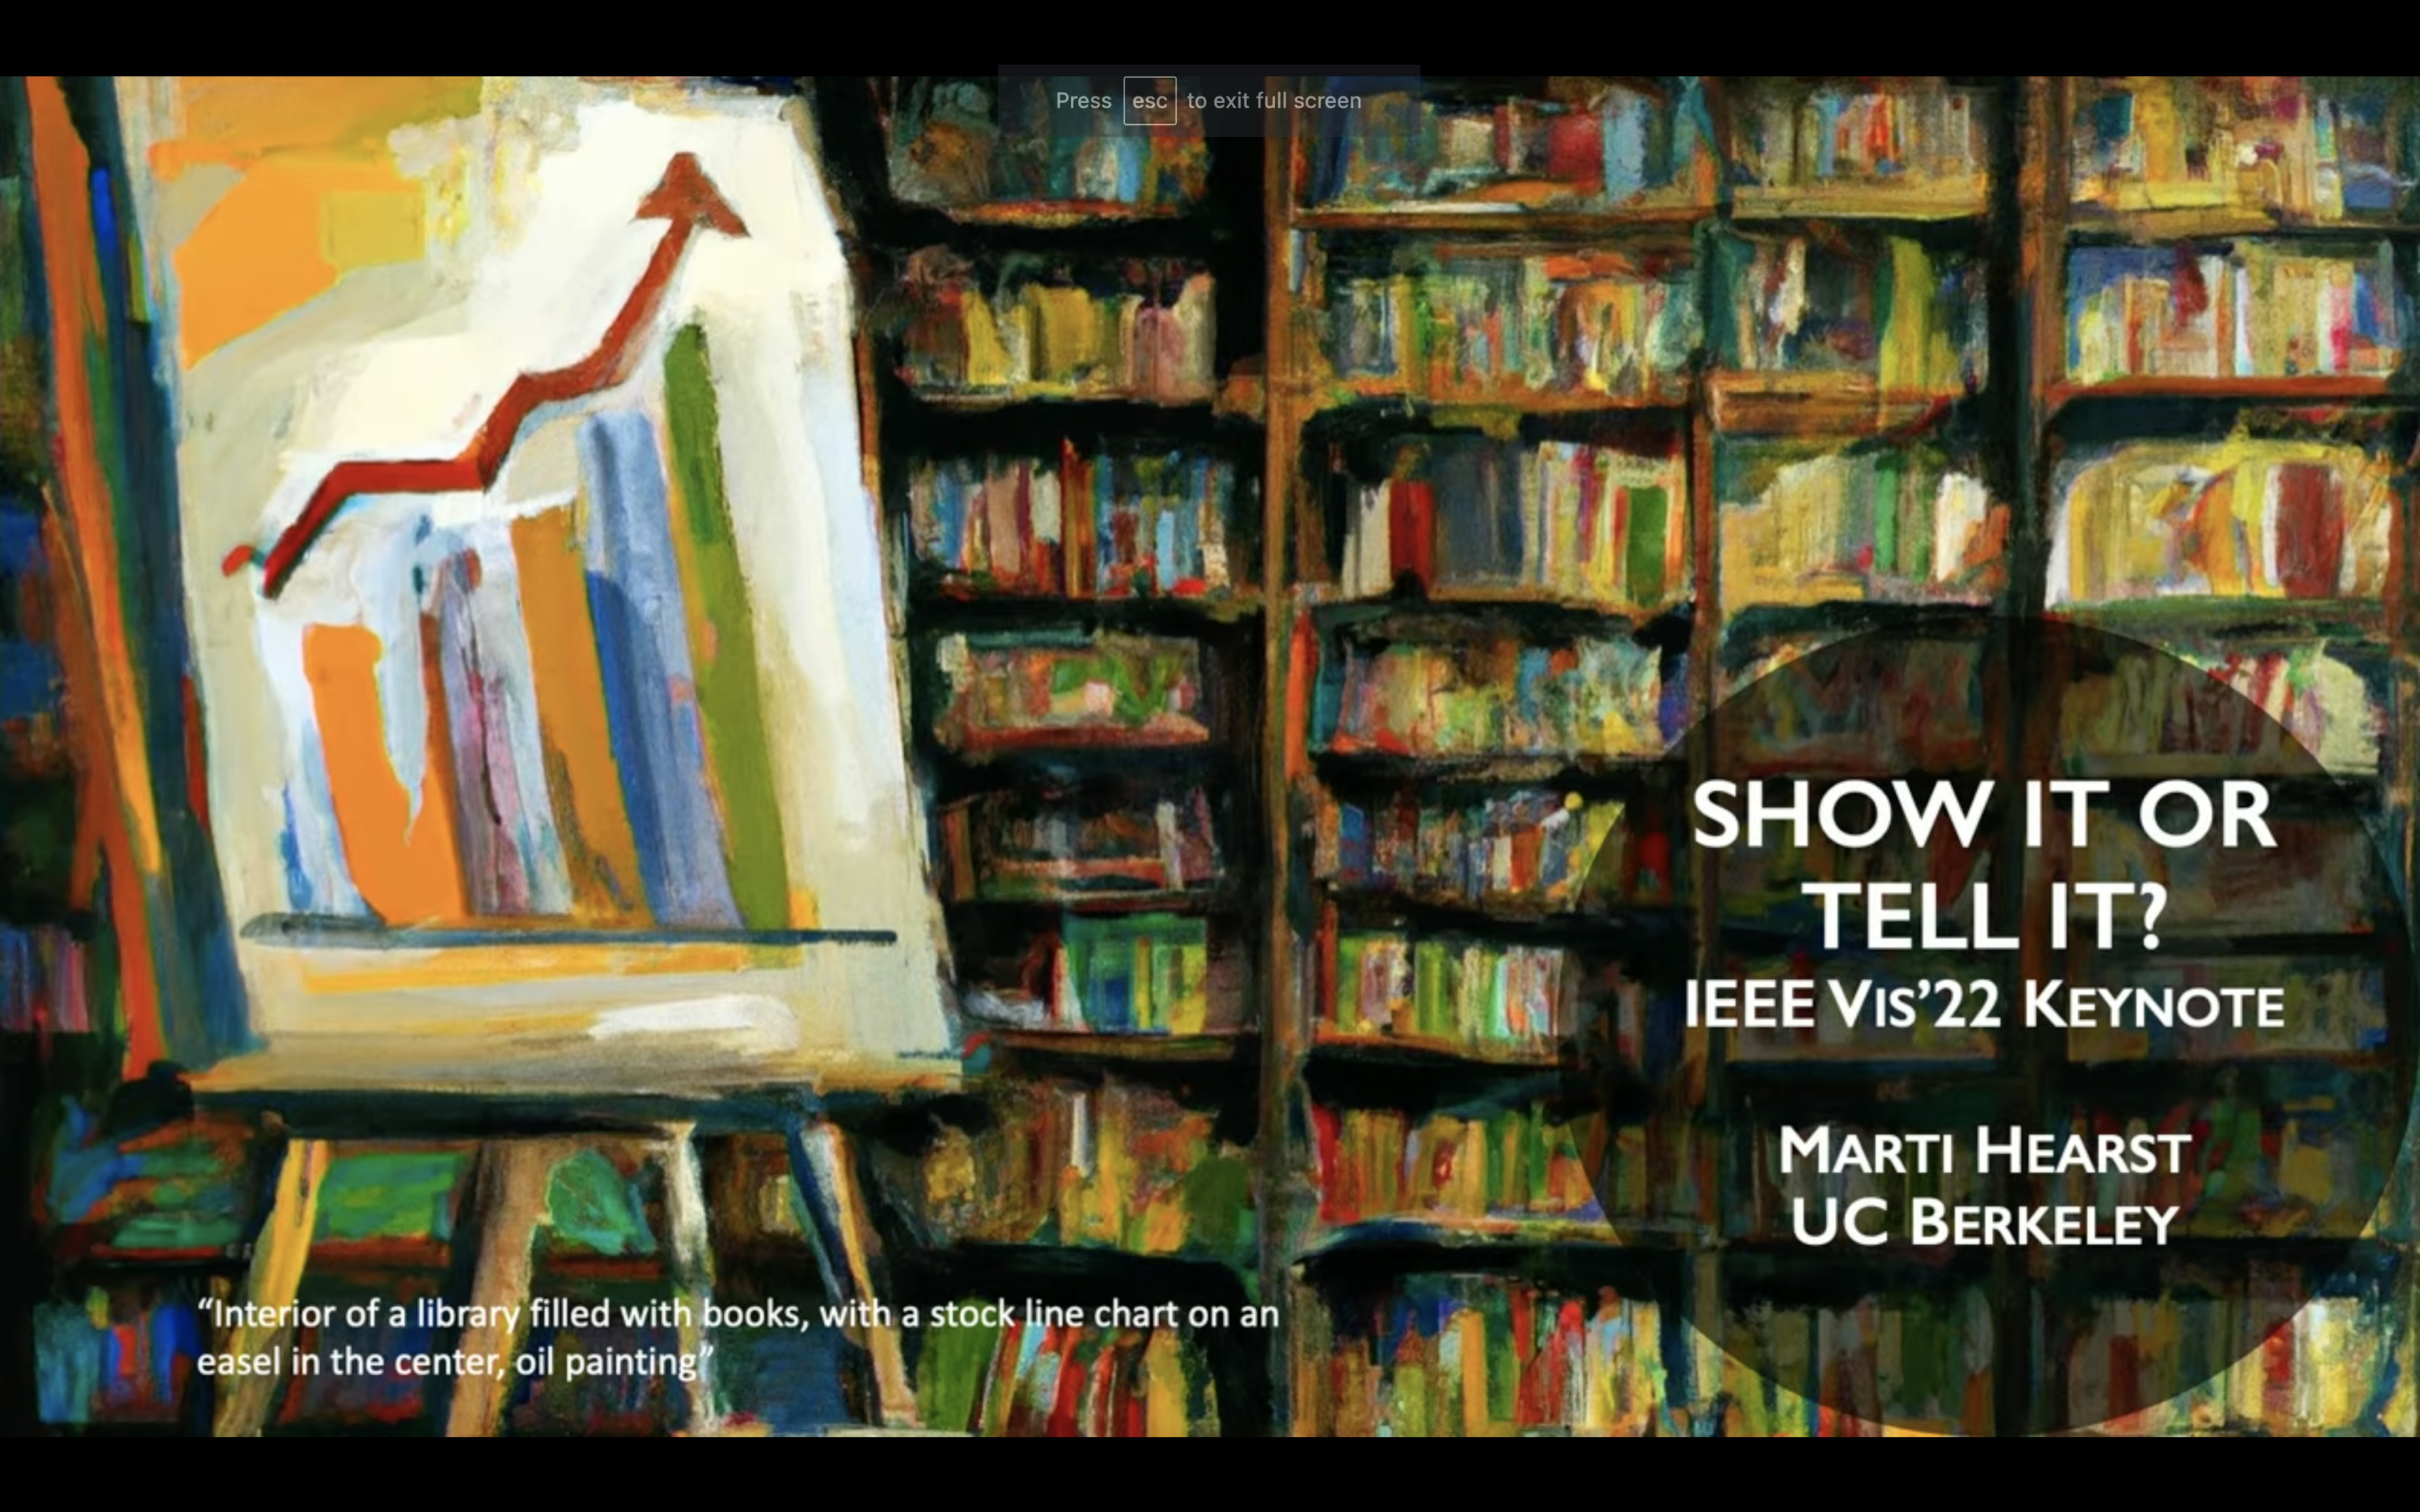
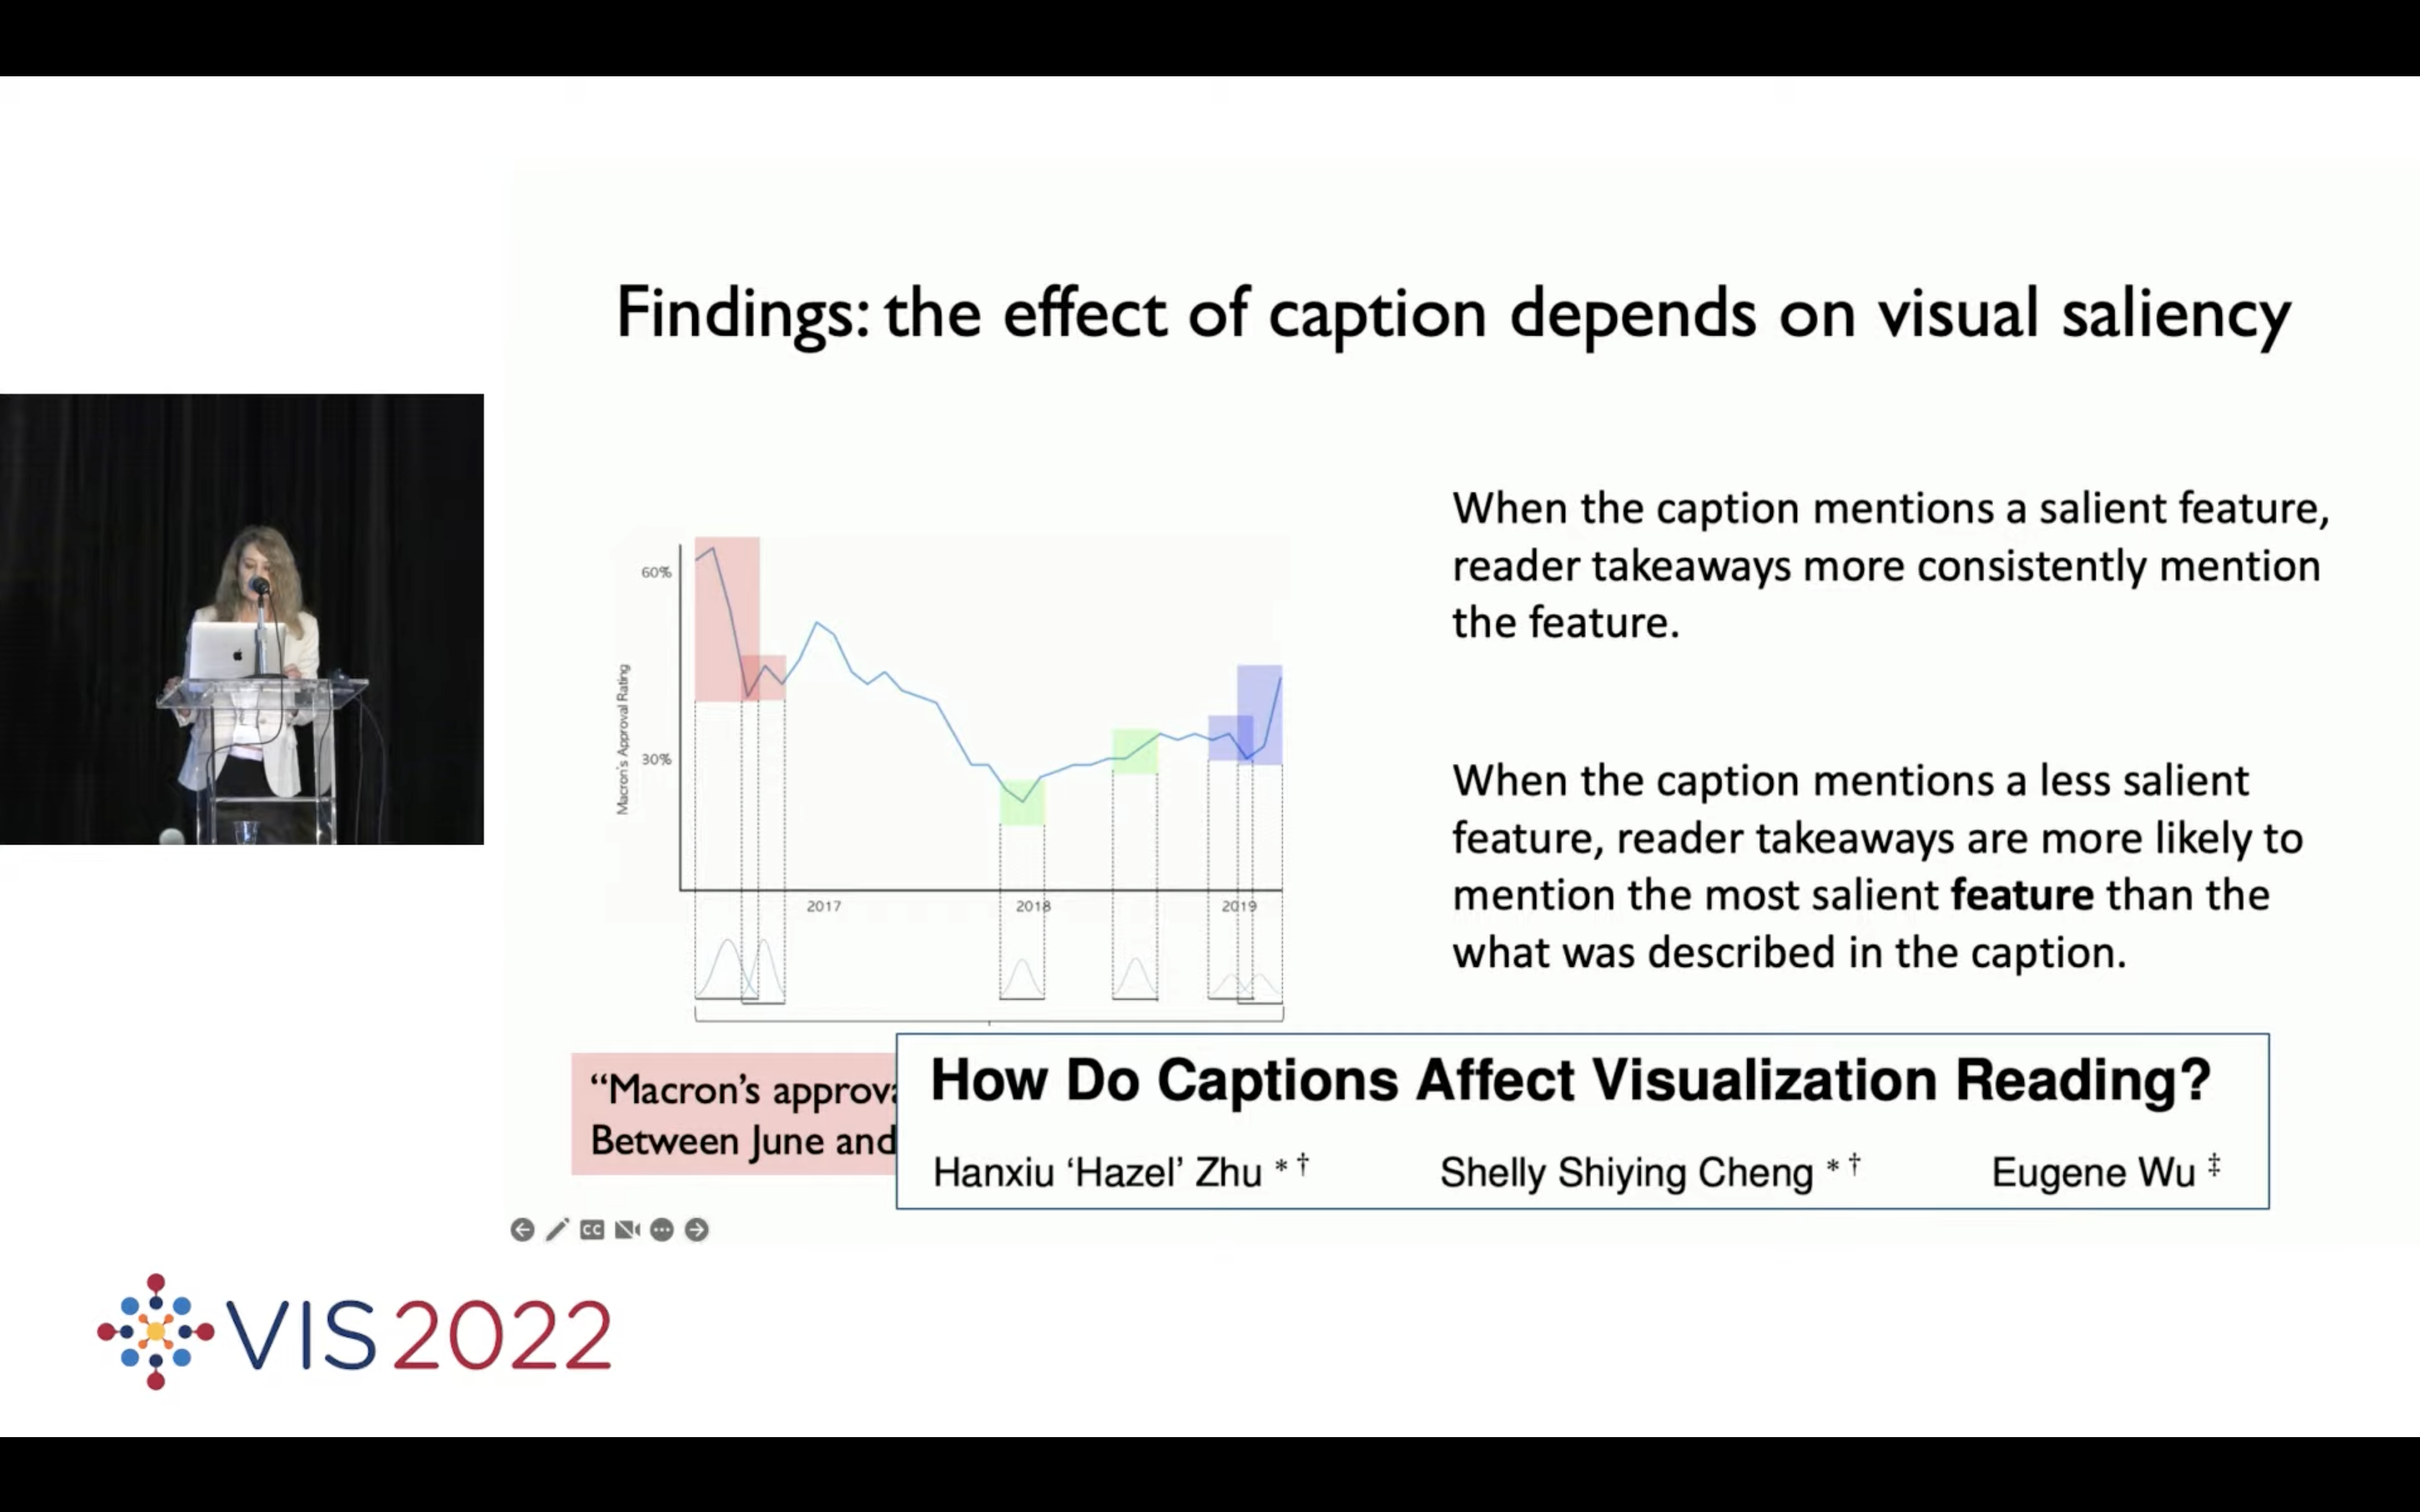
How Do Captions Affect Visualization Reading?
If the visualization is intended to communicate specific features, should the caption be statistical, and focus on specific values, or perceptual, and focus on general patterns?
Authors: [ Hazel Zhu, Shelly Cheng ]*, Eugene Wu (*equal contribution)
Presented at IEEE Visualization Conference 2022 VisComm Workshop
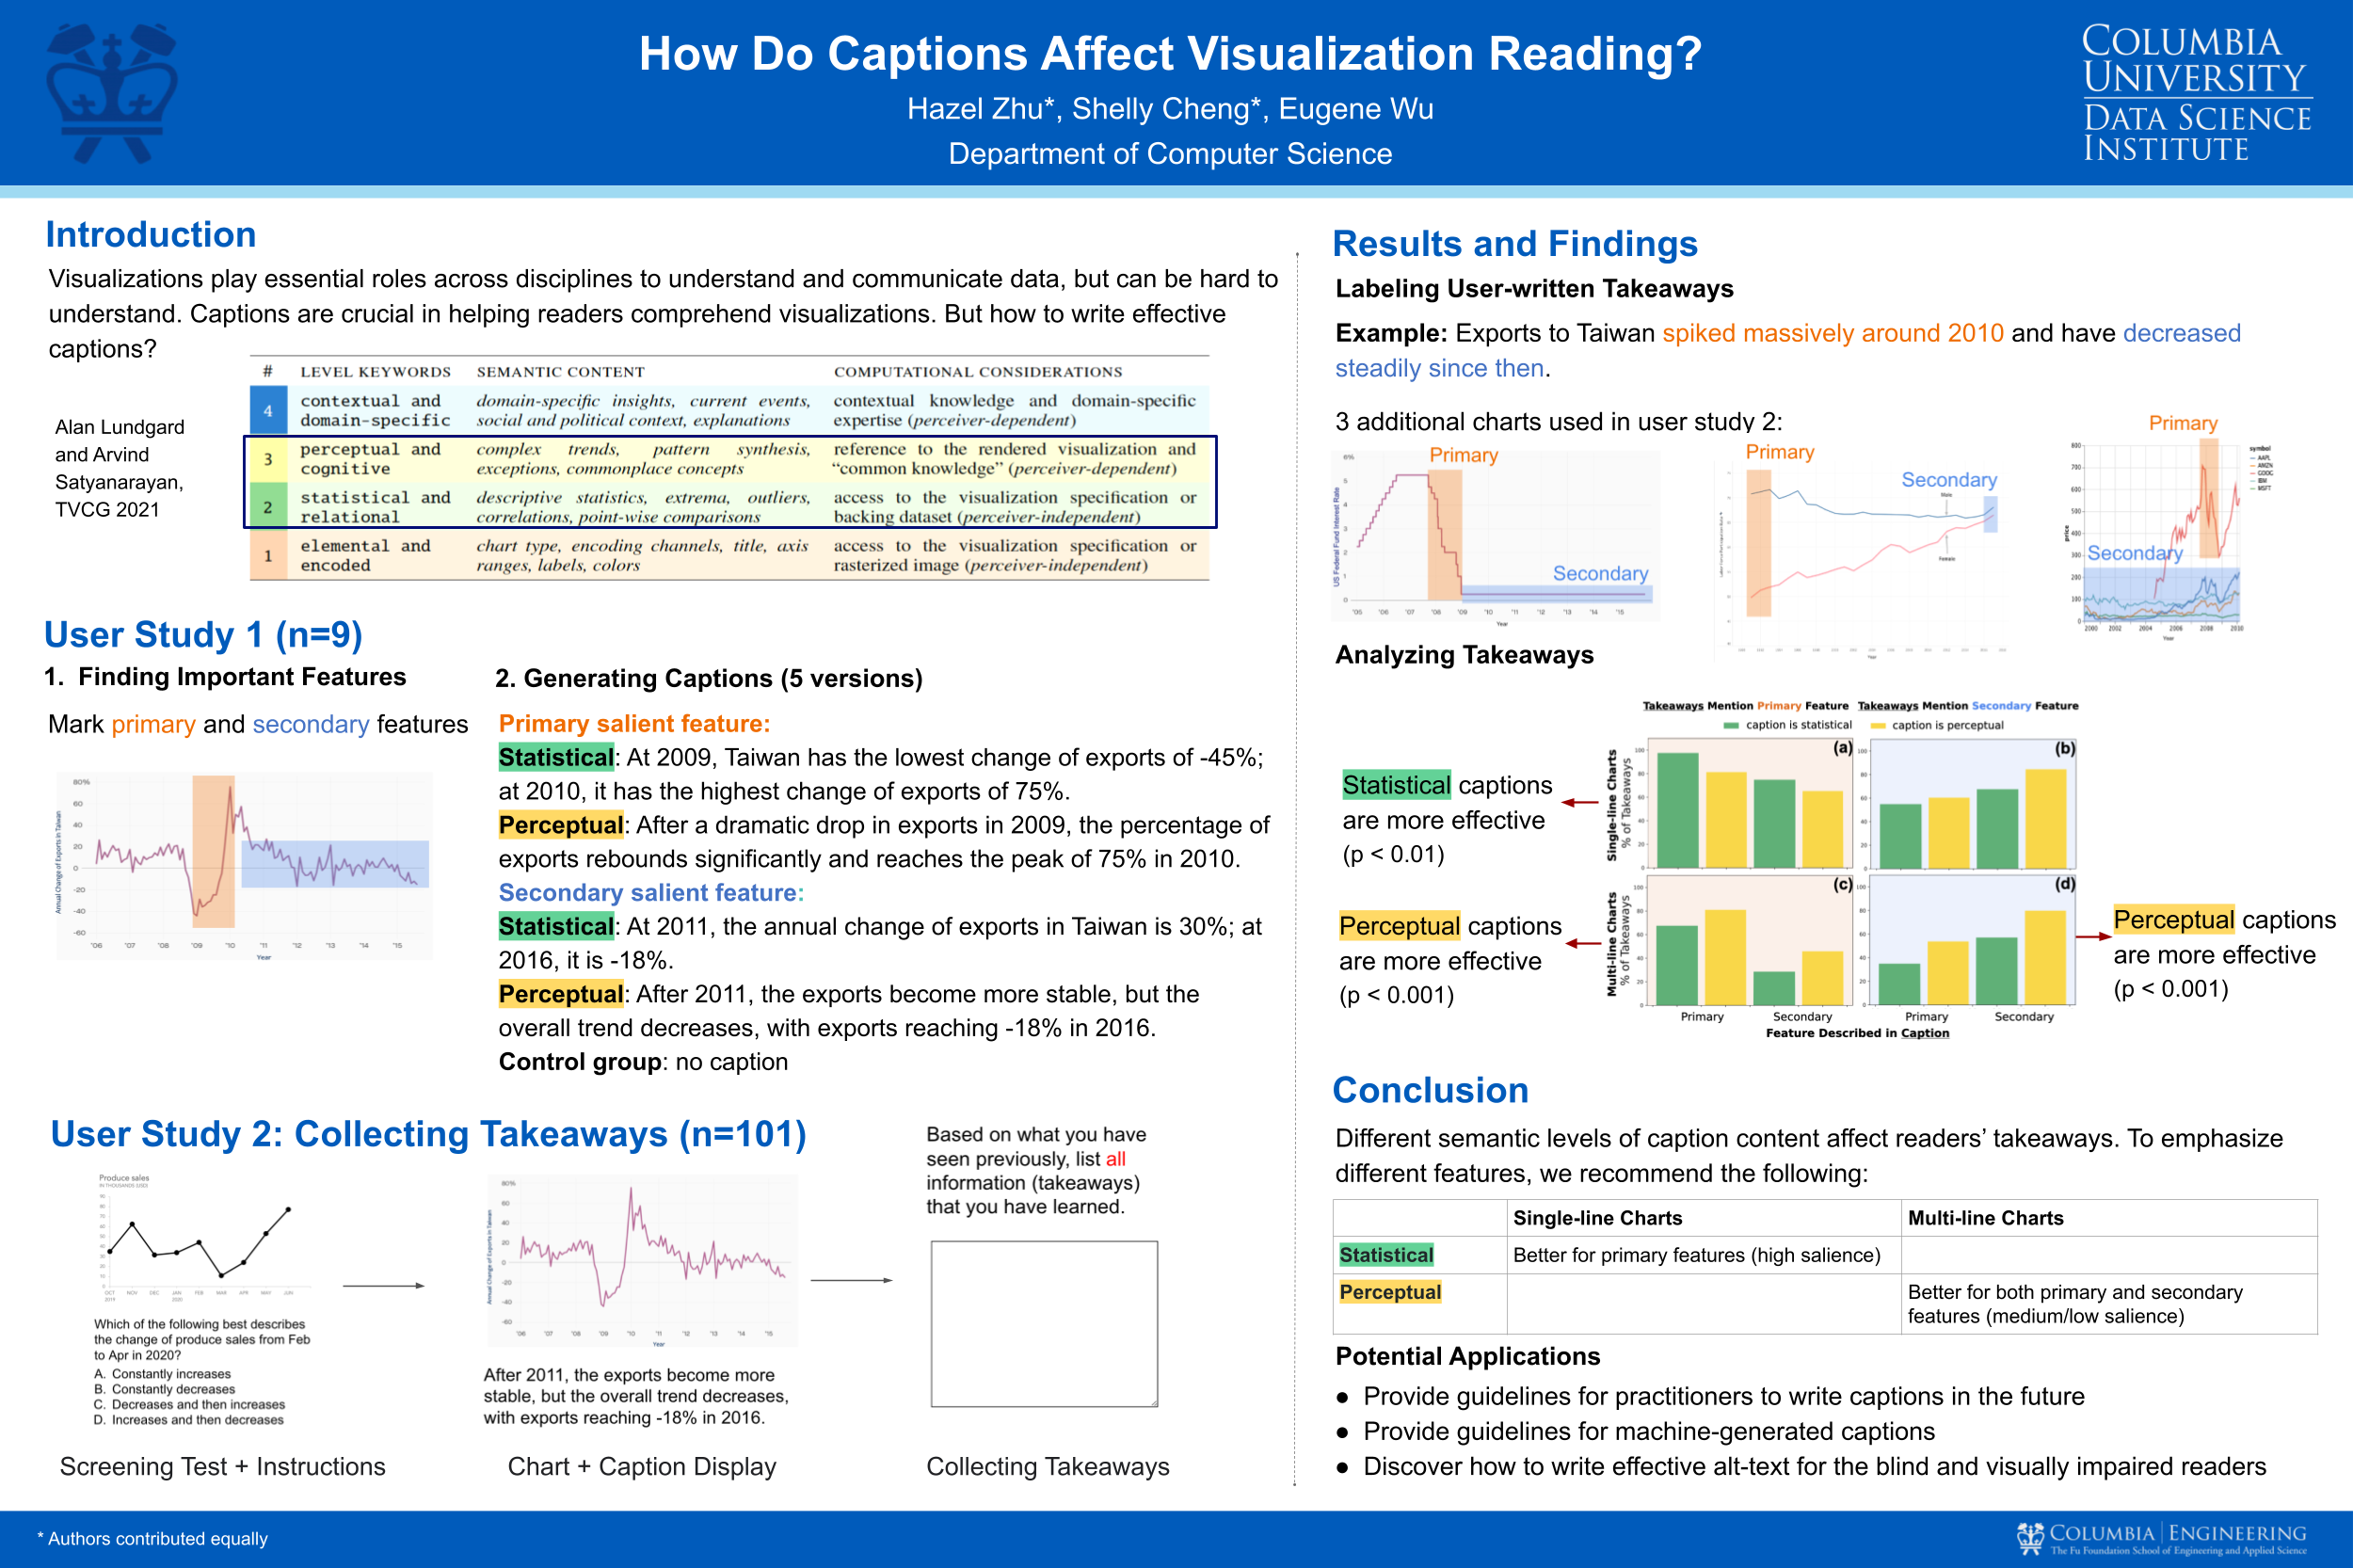
Full abstract: Captions help readers better understand visualizations. However, if the visualization is intended to communicate specific features, should the caption be statistical, and focus on specific values, or perceptual, and focus on general patterns? Prior work has shown that when captions mention visually salient features, users tend to recall those features. Still, we lack explicit guidelines for how to compose the appropriate caption. Further, what if the author wishes to emphasize a less salient feature?
In this paper, we study how the visual salience of the feature described in a caption, and the semantic level of the caption description, affect a reader's takeaways from line charts. For each single- or multi-line chart, we generate 4 captions that 1) describe either the primary or secondary most salient feature in a chart, and 2) describe the feature either at the statistical or perceptual levels. We then show users random chart-caption pairs and record their takeaways.
We find that the primary salient feature is more memorable for single-line charts when the caption is expressed at the statistical level; for secondary salient features in single- and multi-line charts, the perceptual level is more memorable. We also find that many users will tend to rely on erroneous data in the caption and not double-check its veracity against the data in the chart.
Research paper poster
Dr. Marti Hearst, Head of UC Berkeley Information School, even gave a shoutout to our paper during her IEEE Vis'22 opening keynote speech! She commented, "The paper extends prior work in a very interesting way."