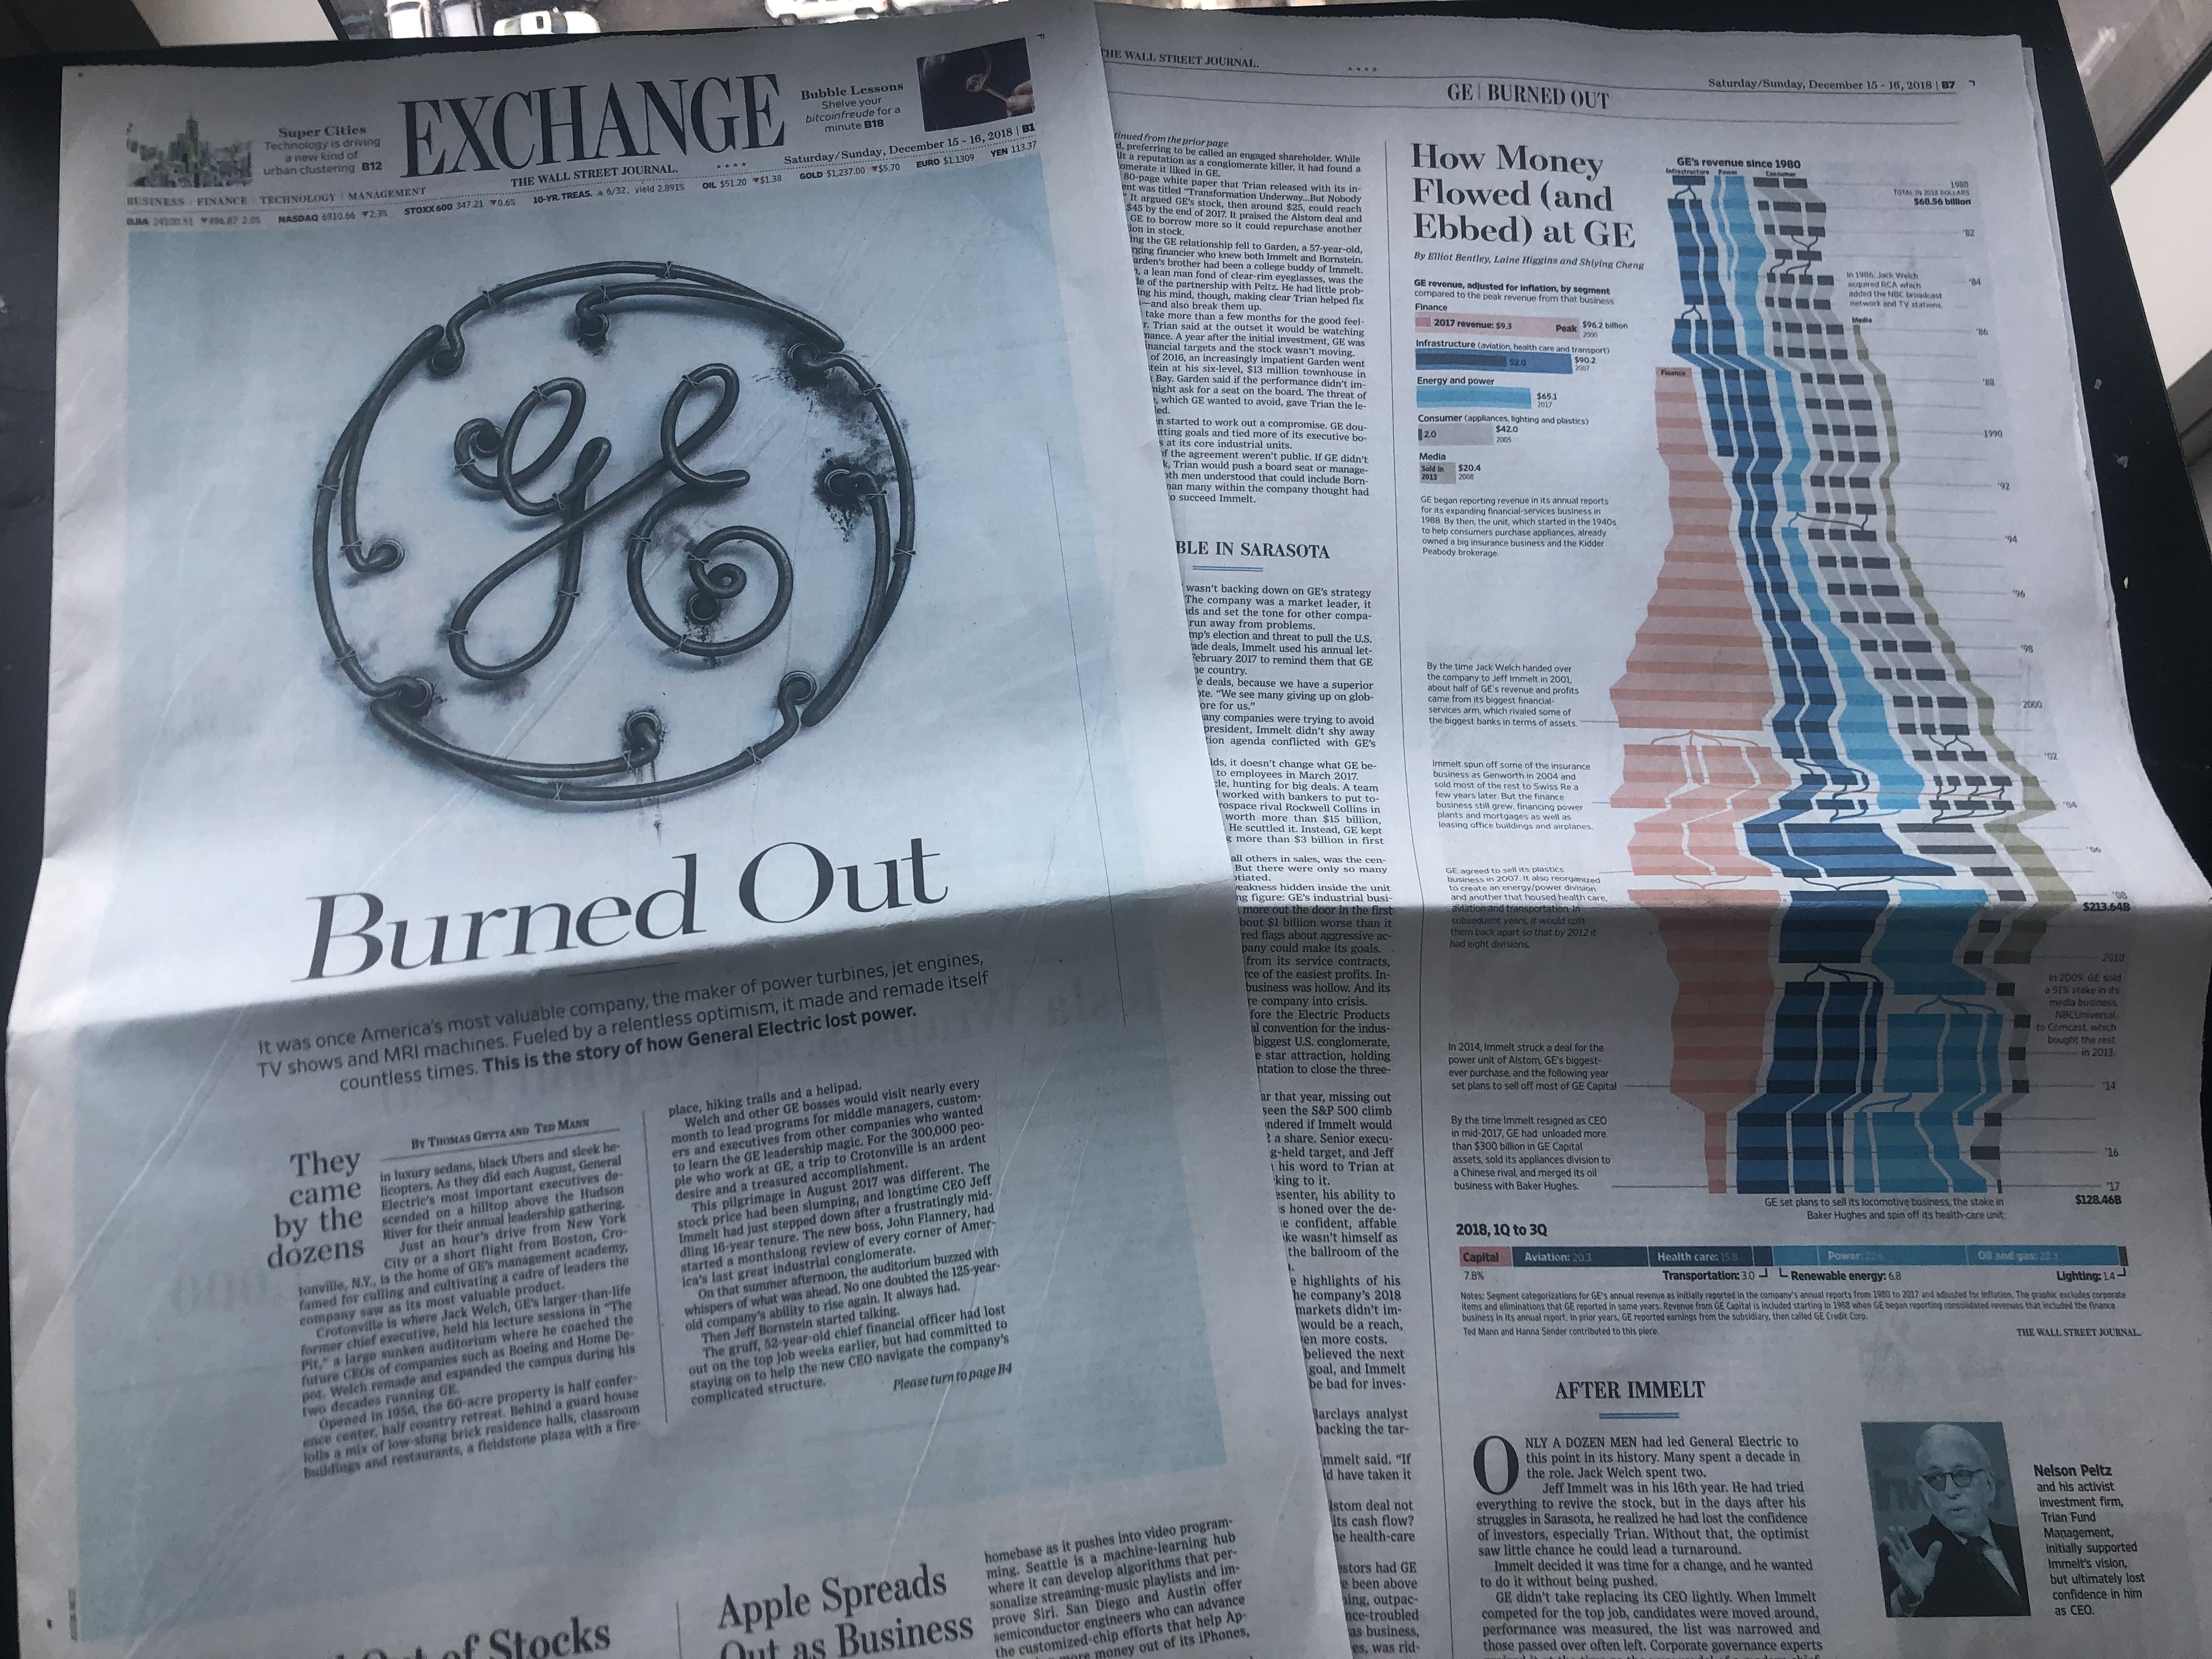
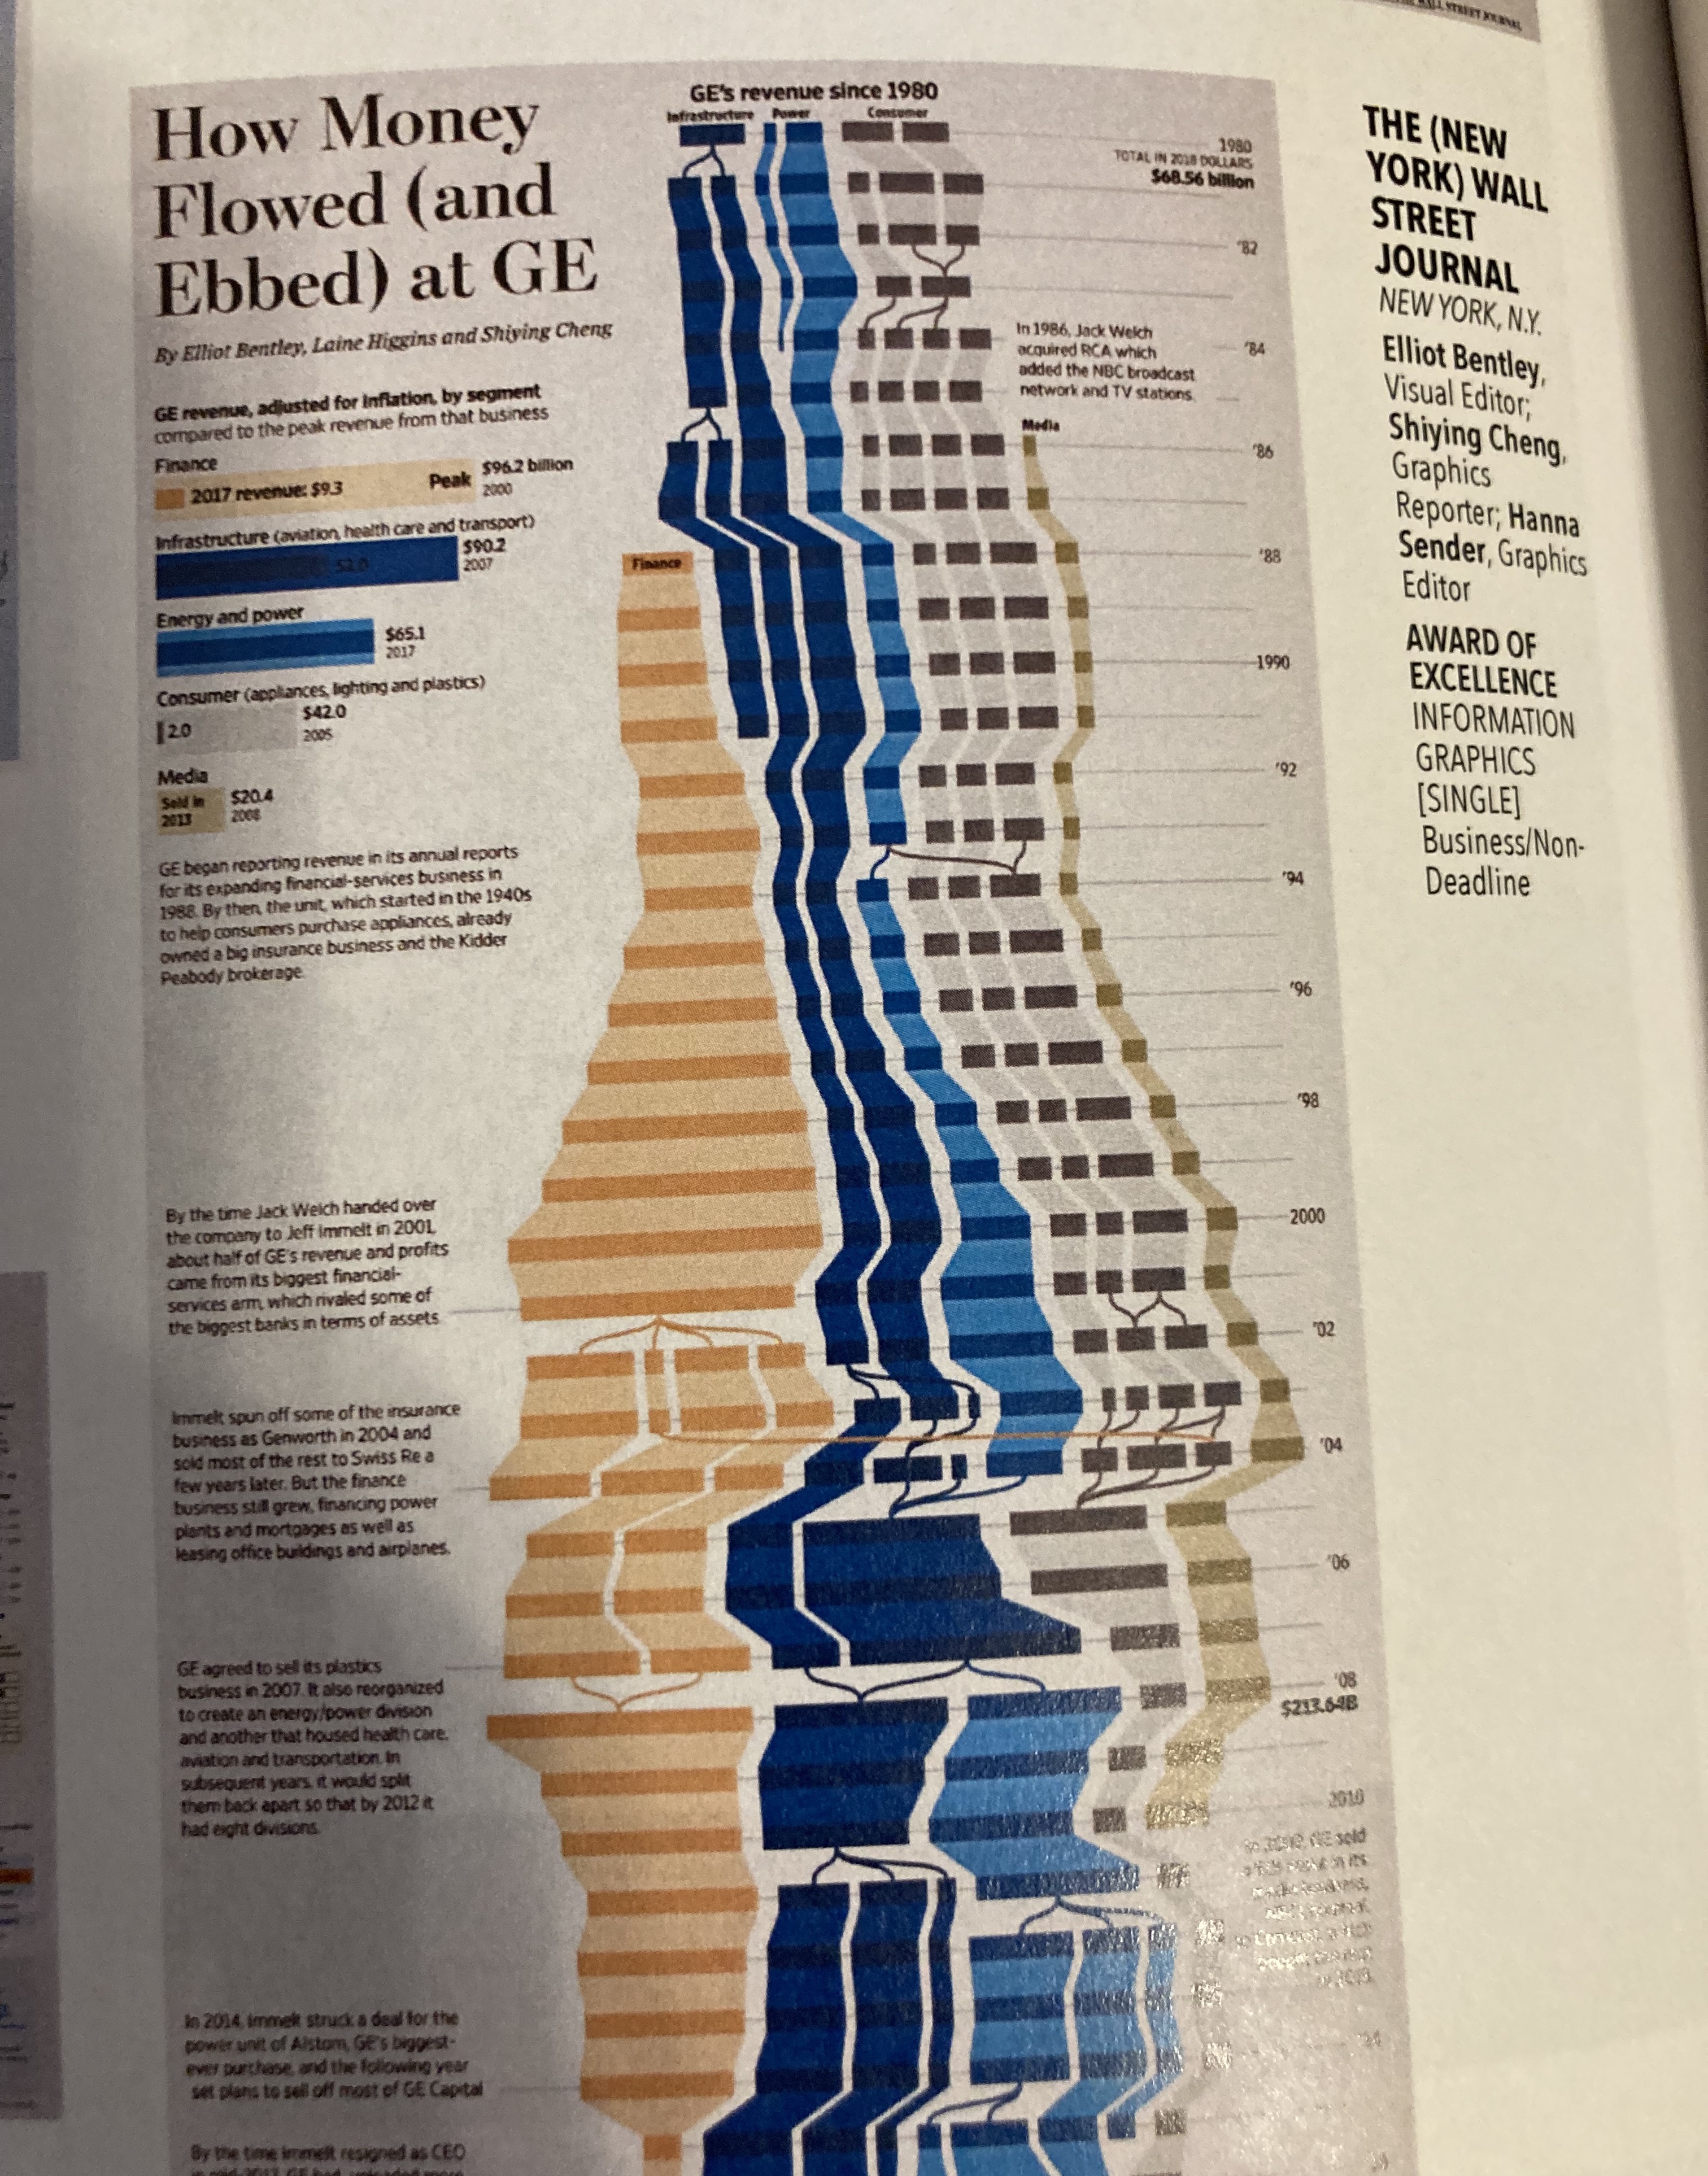
How Money Flowed (and Ebbed) at General Electric
GE’s financial business grew until it nearly capsized the company, 1980 - 2018
The visual story was published as part of The Wall Street Journal’s original series, Burned Out: Inside Story of GE, which explains how the company that was once America’s biggest — the maker of power turbines, the seller of insurance, the broadcaster of ‘Seinfeld’ — became a shadow of its former self. The series was a huge success and has received 1,200,000+ views online. The graphic was also resurfaced on the front page of the newspaper on November 11, 2021, when GE announced that the company would split into three public companies.
The GE Burned Out series, which includes a 11,000 words of enterprise reporting, the visual story I designed and a photo essay featuring GE’s employees over the years, won The Society of American Business Editors and Writers (SABEW)'s Story Topic Award: Small Business/Management/Career (Large Newsrooms) in 2019. The graphic also received the Society for News Design's Award of Excellence under Information Graphics, Business/Non-Deadline category.
WSJ Newspaper, Exchange, Dec 15-16, 2018
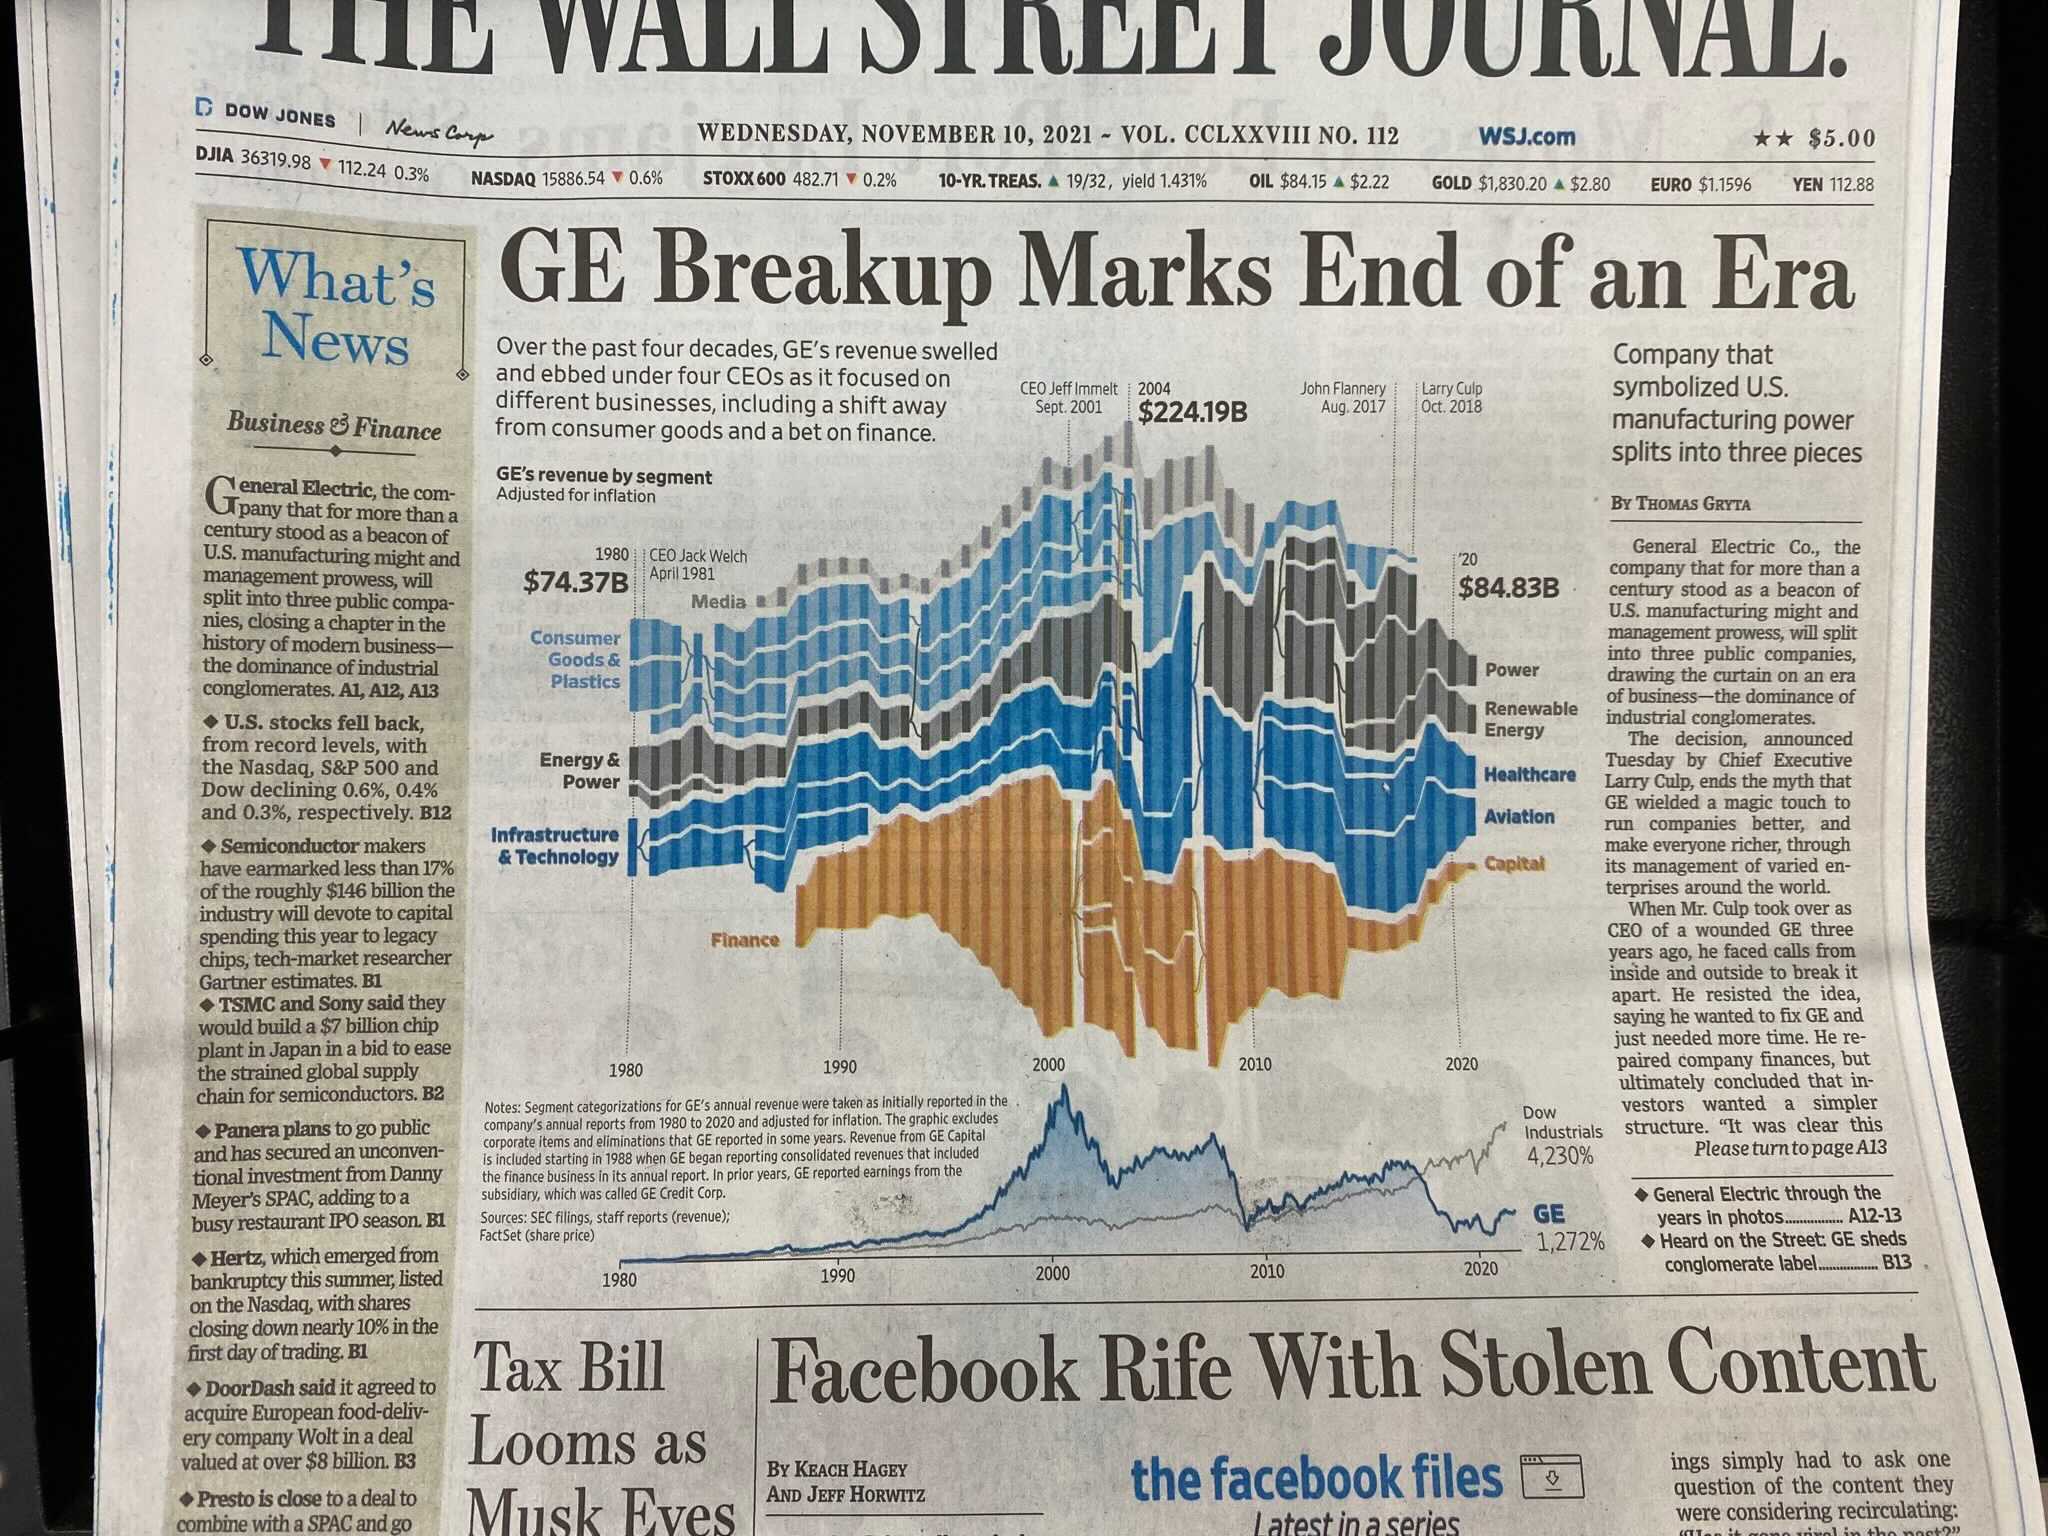
WSJ Newspaper, Front Page, Nov 10, 2021
Award of Excellence, SND 40th Creative Competition
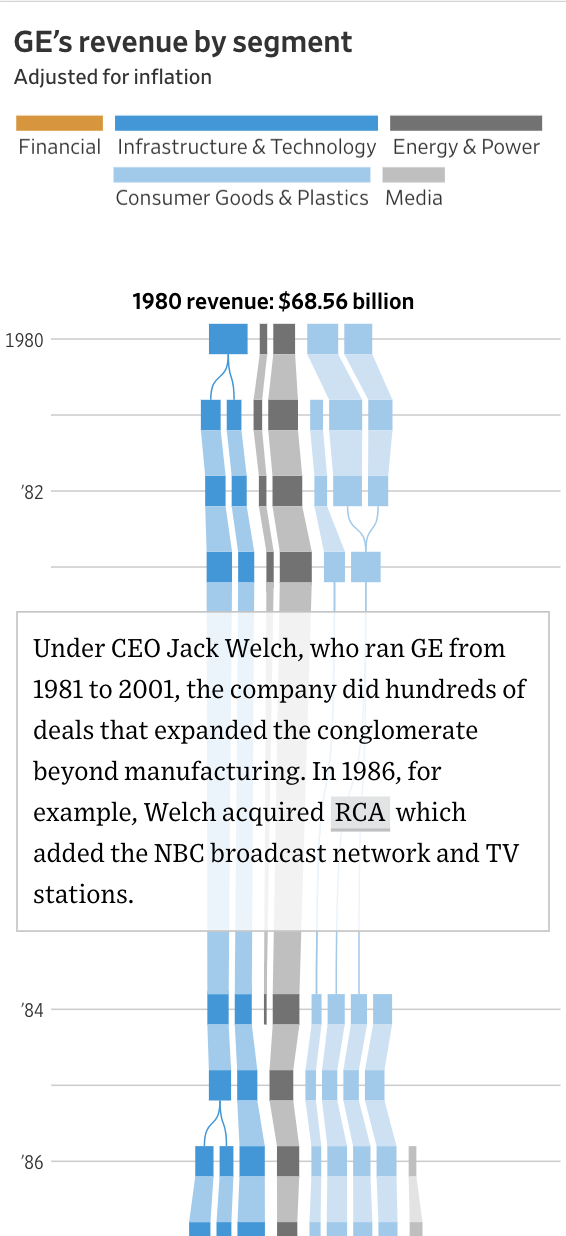
I developed the visual concept in June of 2018 after GE announced that the company would shed two big business units and narrow its focus to power and aviation. Through some casual conversations at work, I learned that GE has reinvented itself so often that it was hard to keep track. Intrigued by those conversations, I pitched the idea to do a visual story that details the evolution of GE.
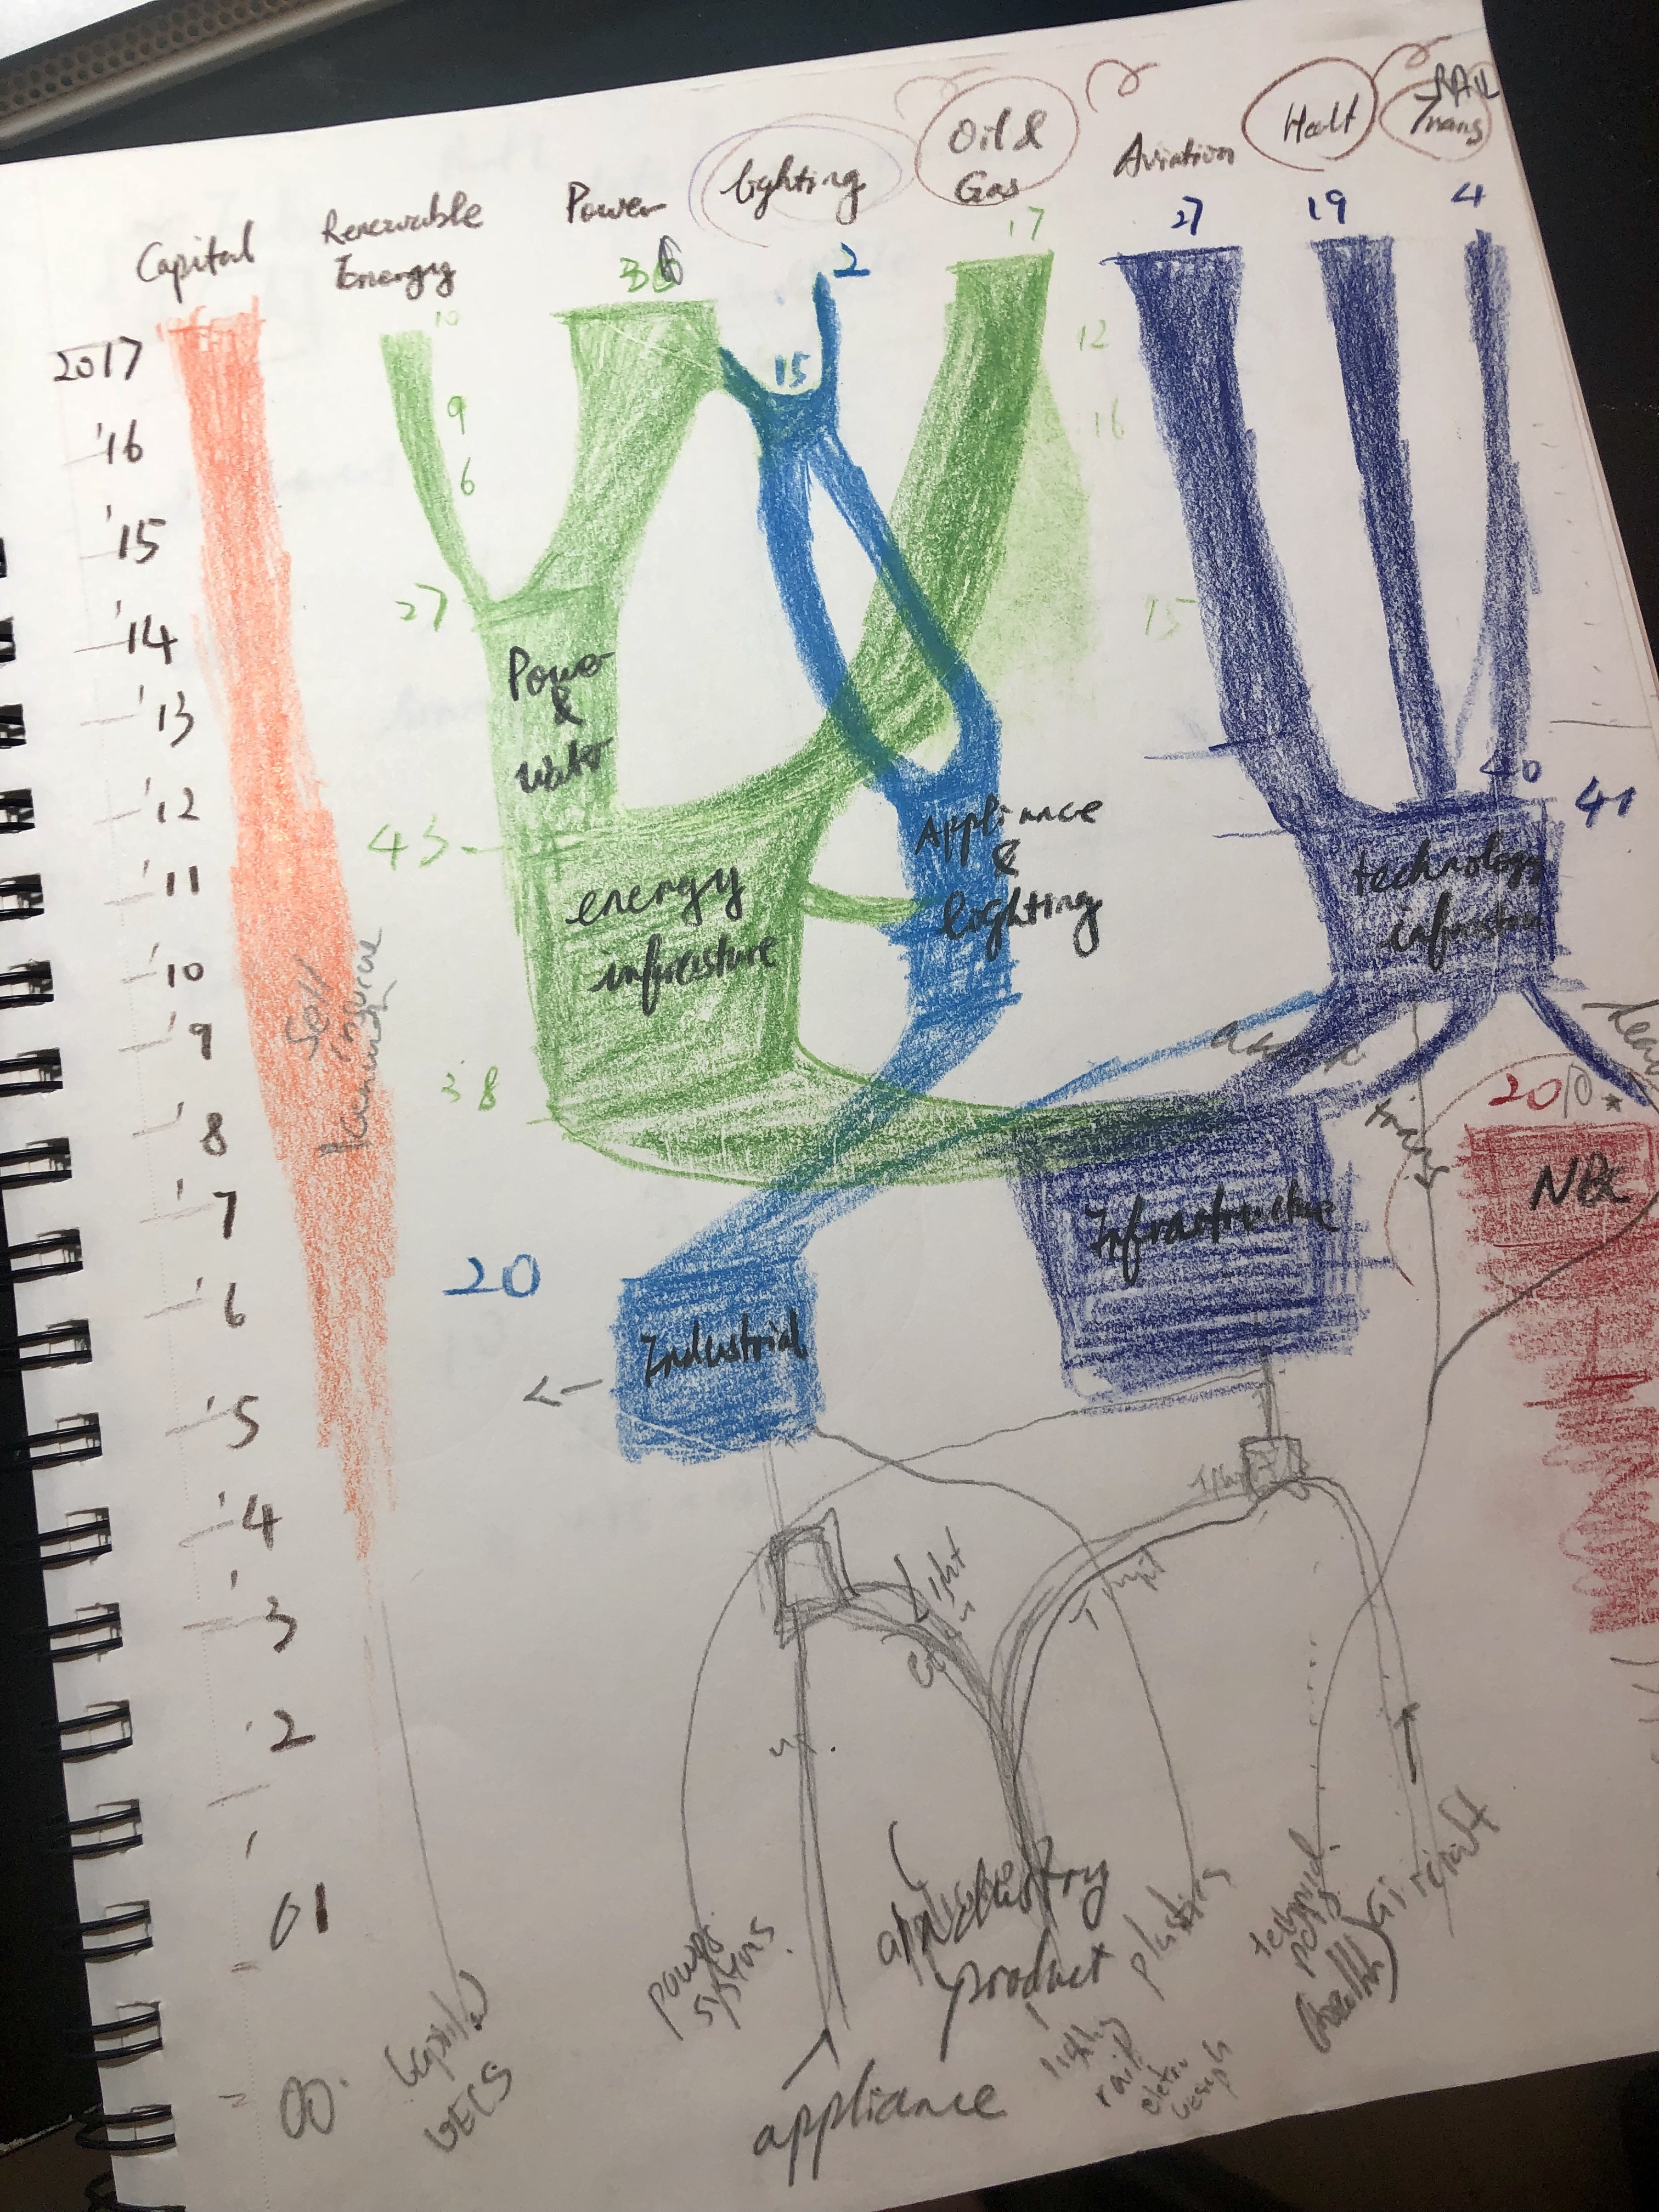
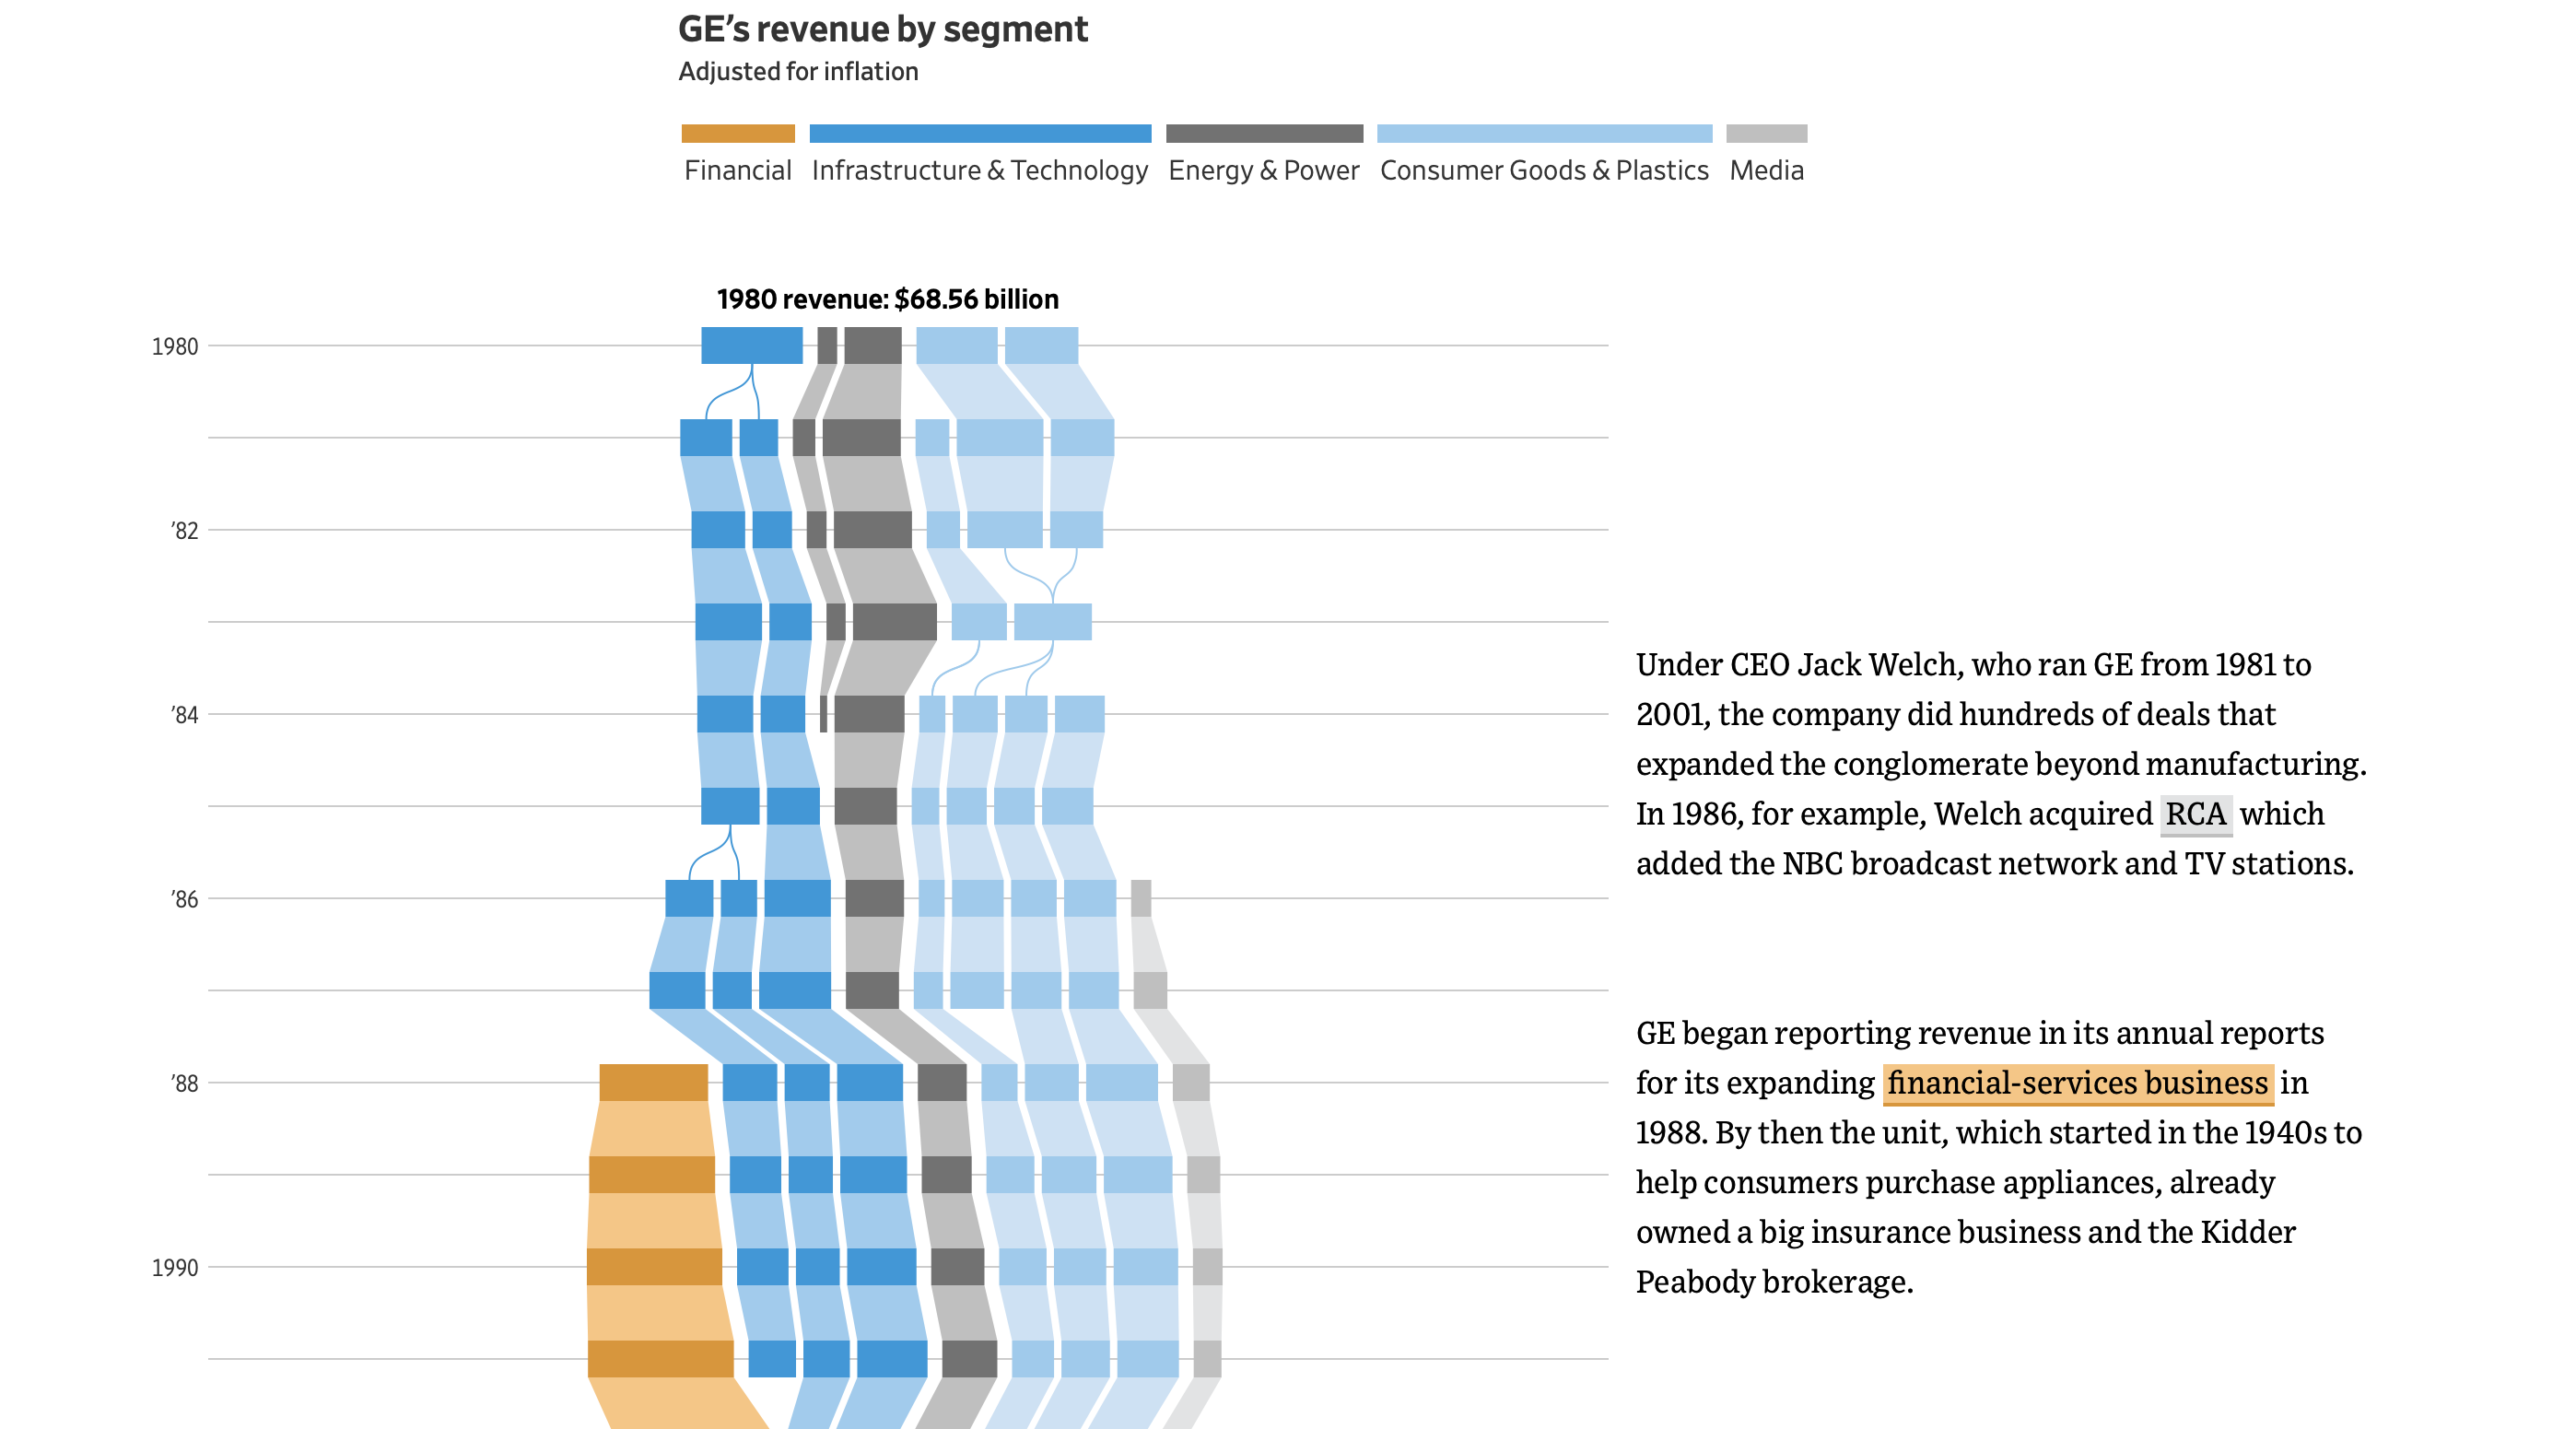
To finish the story, I went through the company’s physical copies of earnings reports and analyzed its SEC filings since 1980. After rounds of trial and error, I ended with the vertical design of the Sankey chart, starting in 1980 and using five colors to highlight different segments of GE’s business.
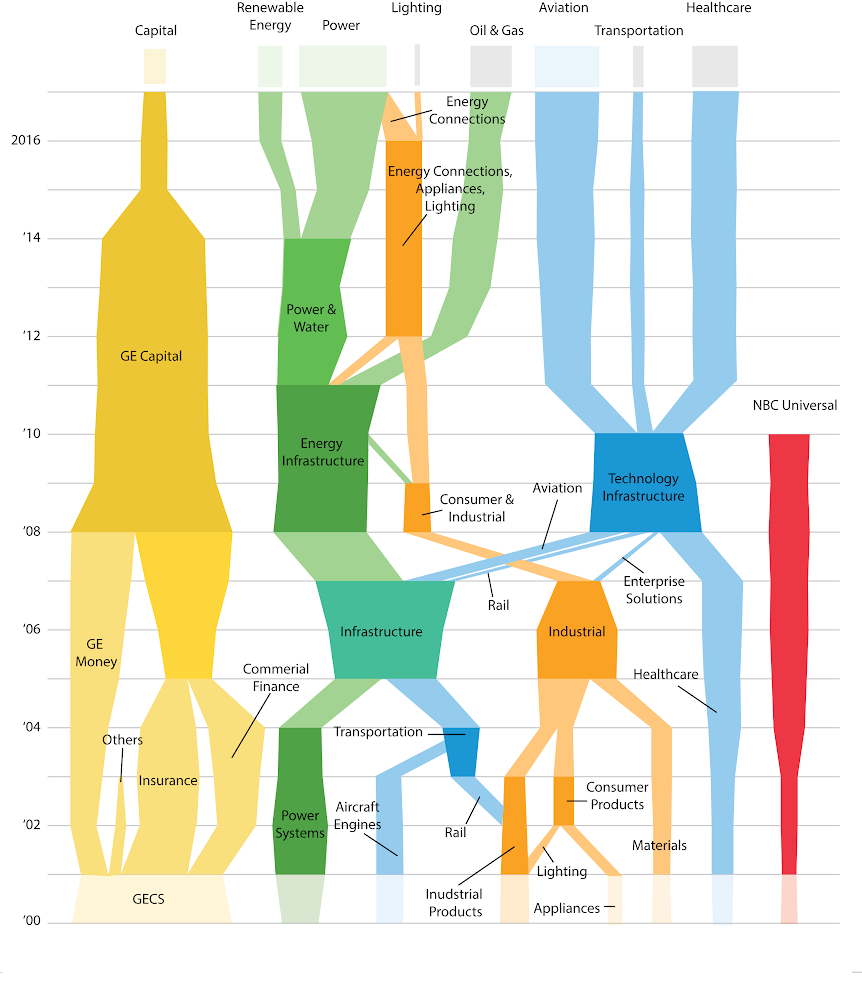
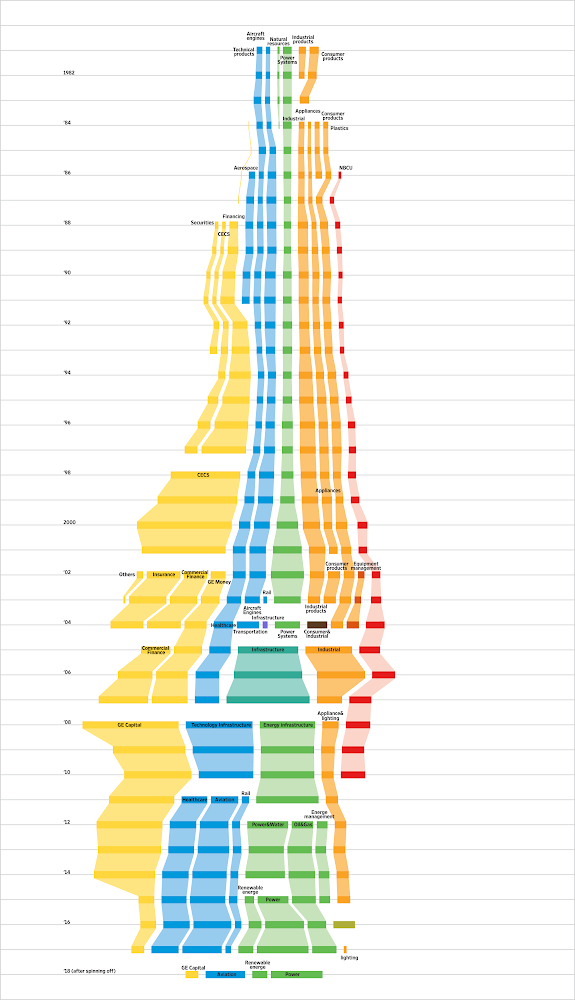
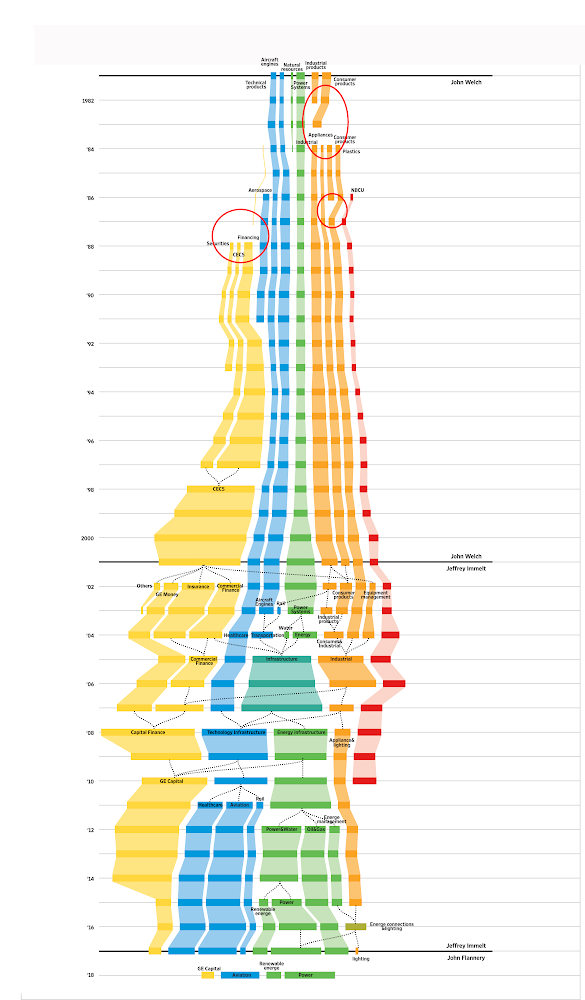
The visual story was written about in Junk Charts, a leading data visualization blog. Kaiser Fung writes, "What grabbed my attention? The less-used chart form, and the appealing but not too gaudy color scheme. The chart presents a highly digestible view of the structure of GE’s revenues. We learn about GE’s major divisions, as well as how certain segments split from or merged with others over time."
Final Representation:

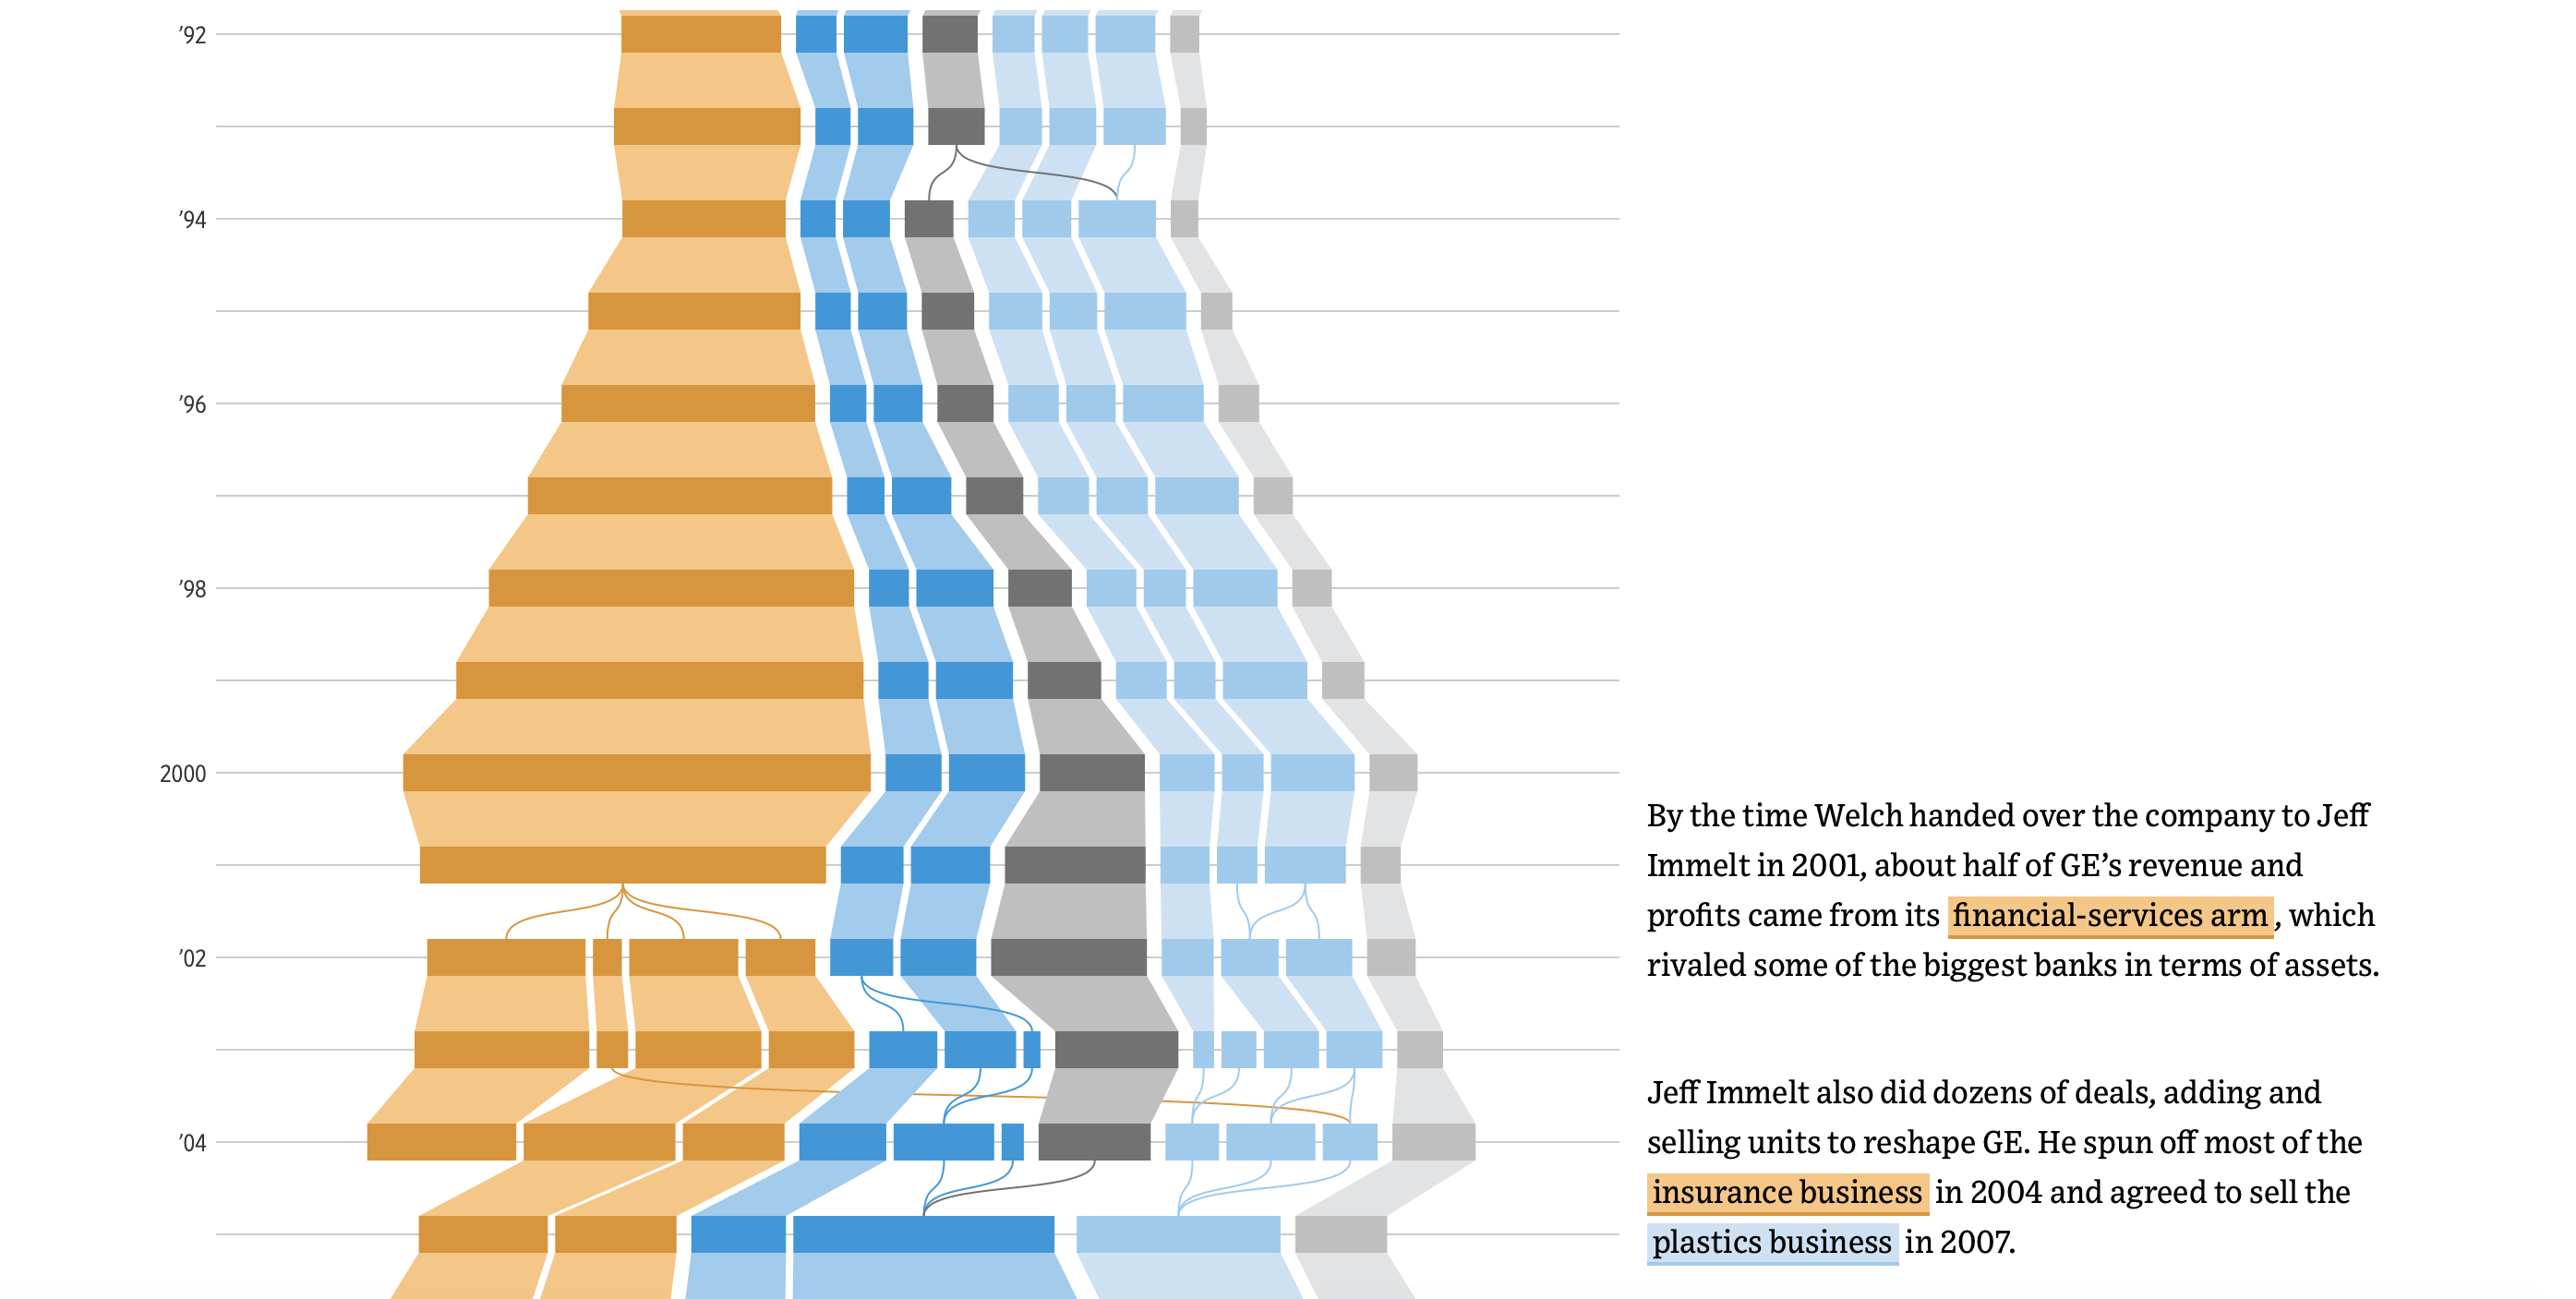
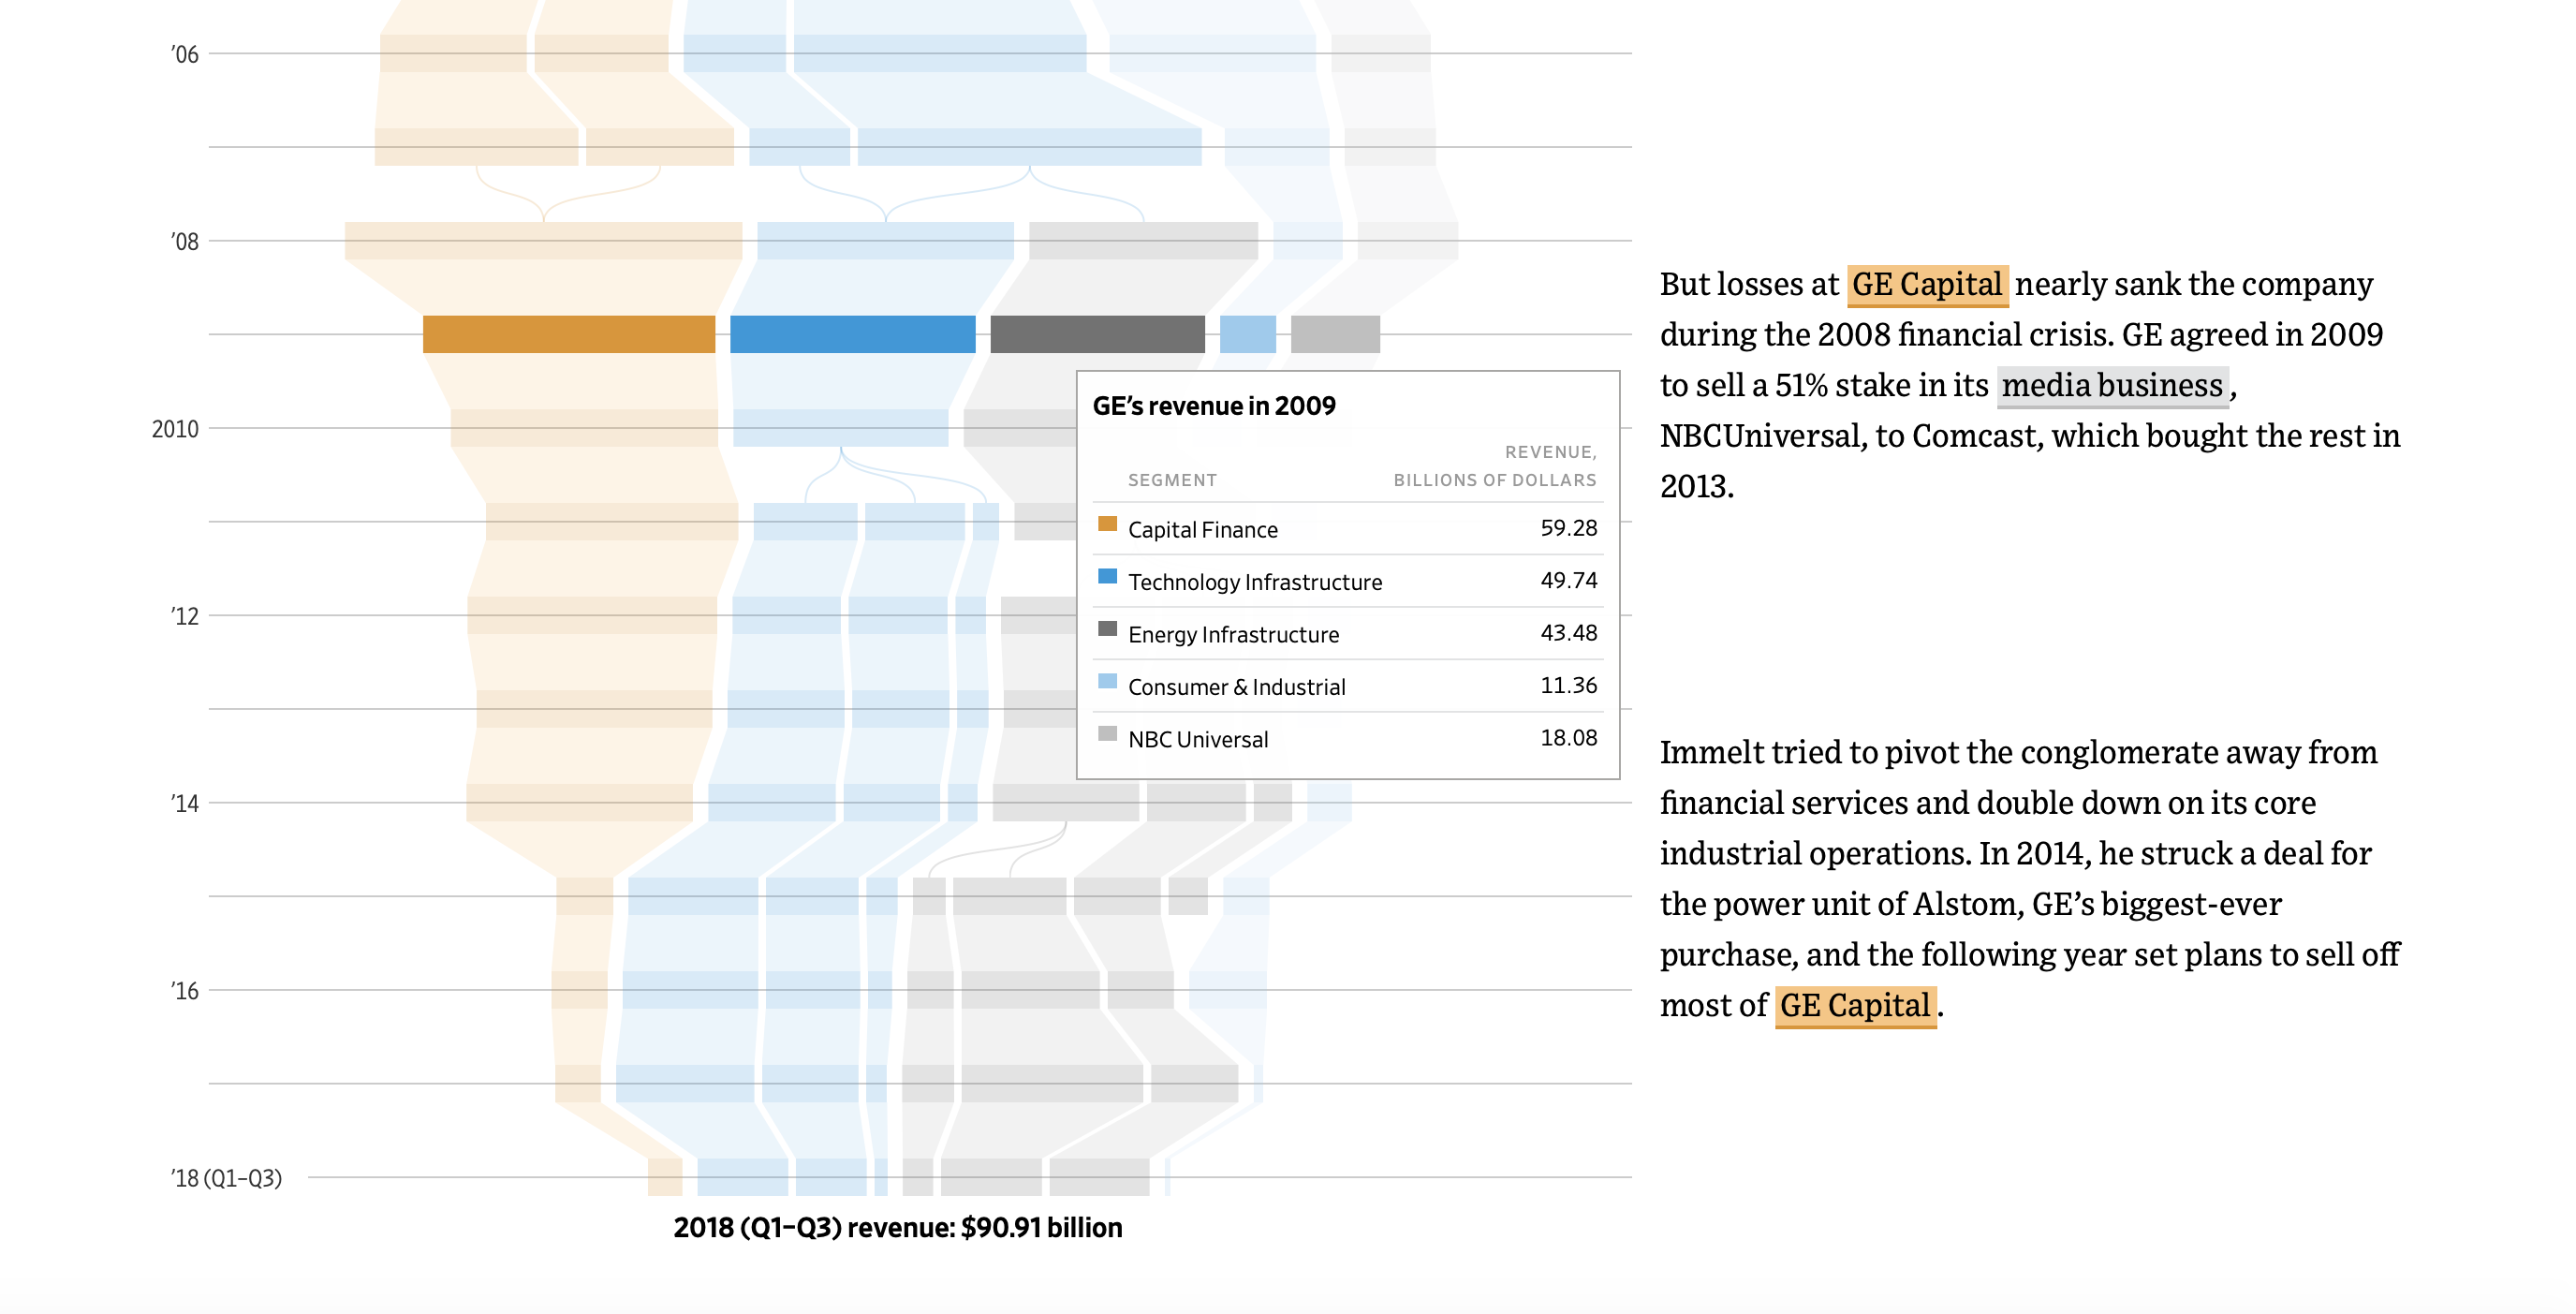
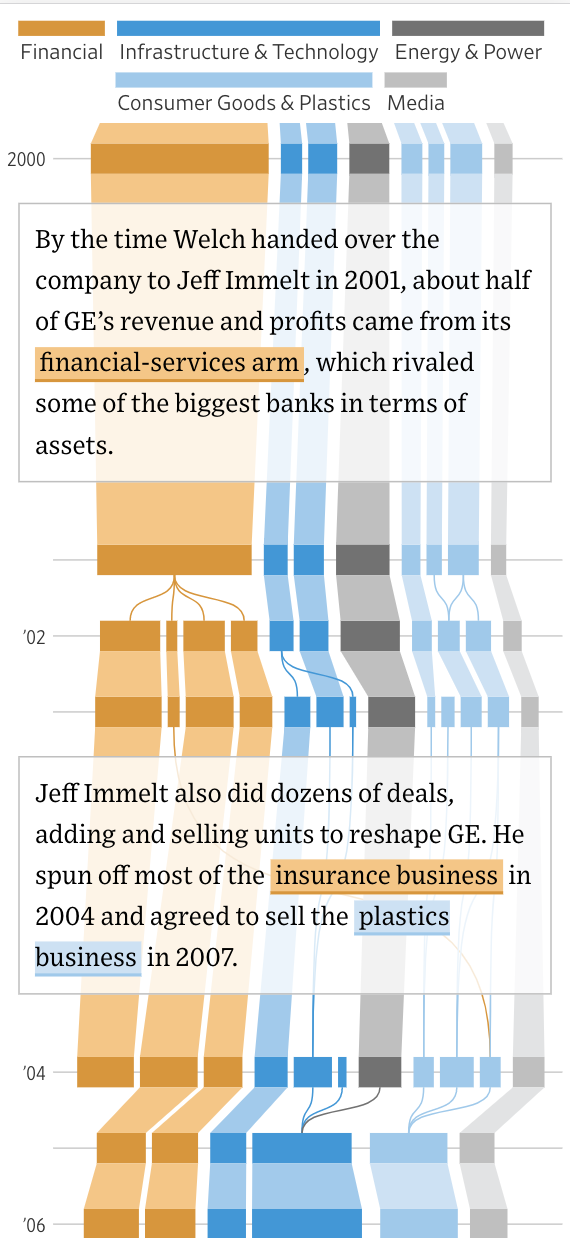
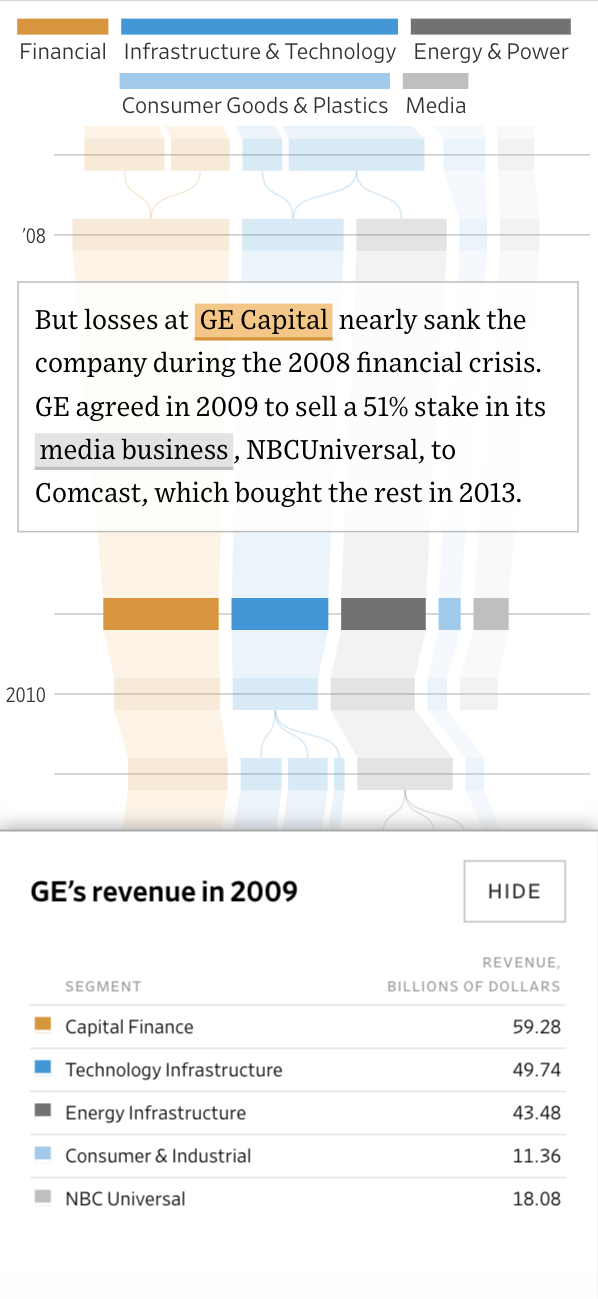
"For decades, General Electric was mostly a manufacturer whose factories churned out machines. During Jack Welch’s reign, the company’s finance arm ballooned, powering extraordinary growth. At its height, it accounted for about half of GE’s revenue and rivaled the biggest U.S. banks. Then came the financial crisis, which forced Jeff Immelt to scale it back. GE Capital is now a tiny part of the company, but its troubles still loom large."
Desktop Version:
Using HTML, CSS, JavaScript, and D3.js
Mobile Version:
Using HTML, CSS, JavaScript, and D3.js
Print Version:
Using Illustrator
-
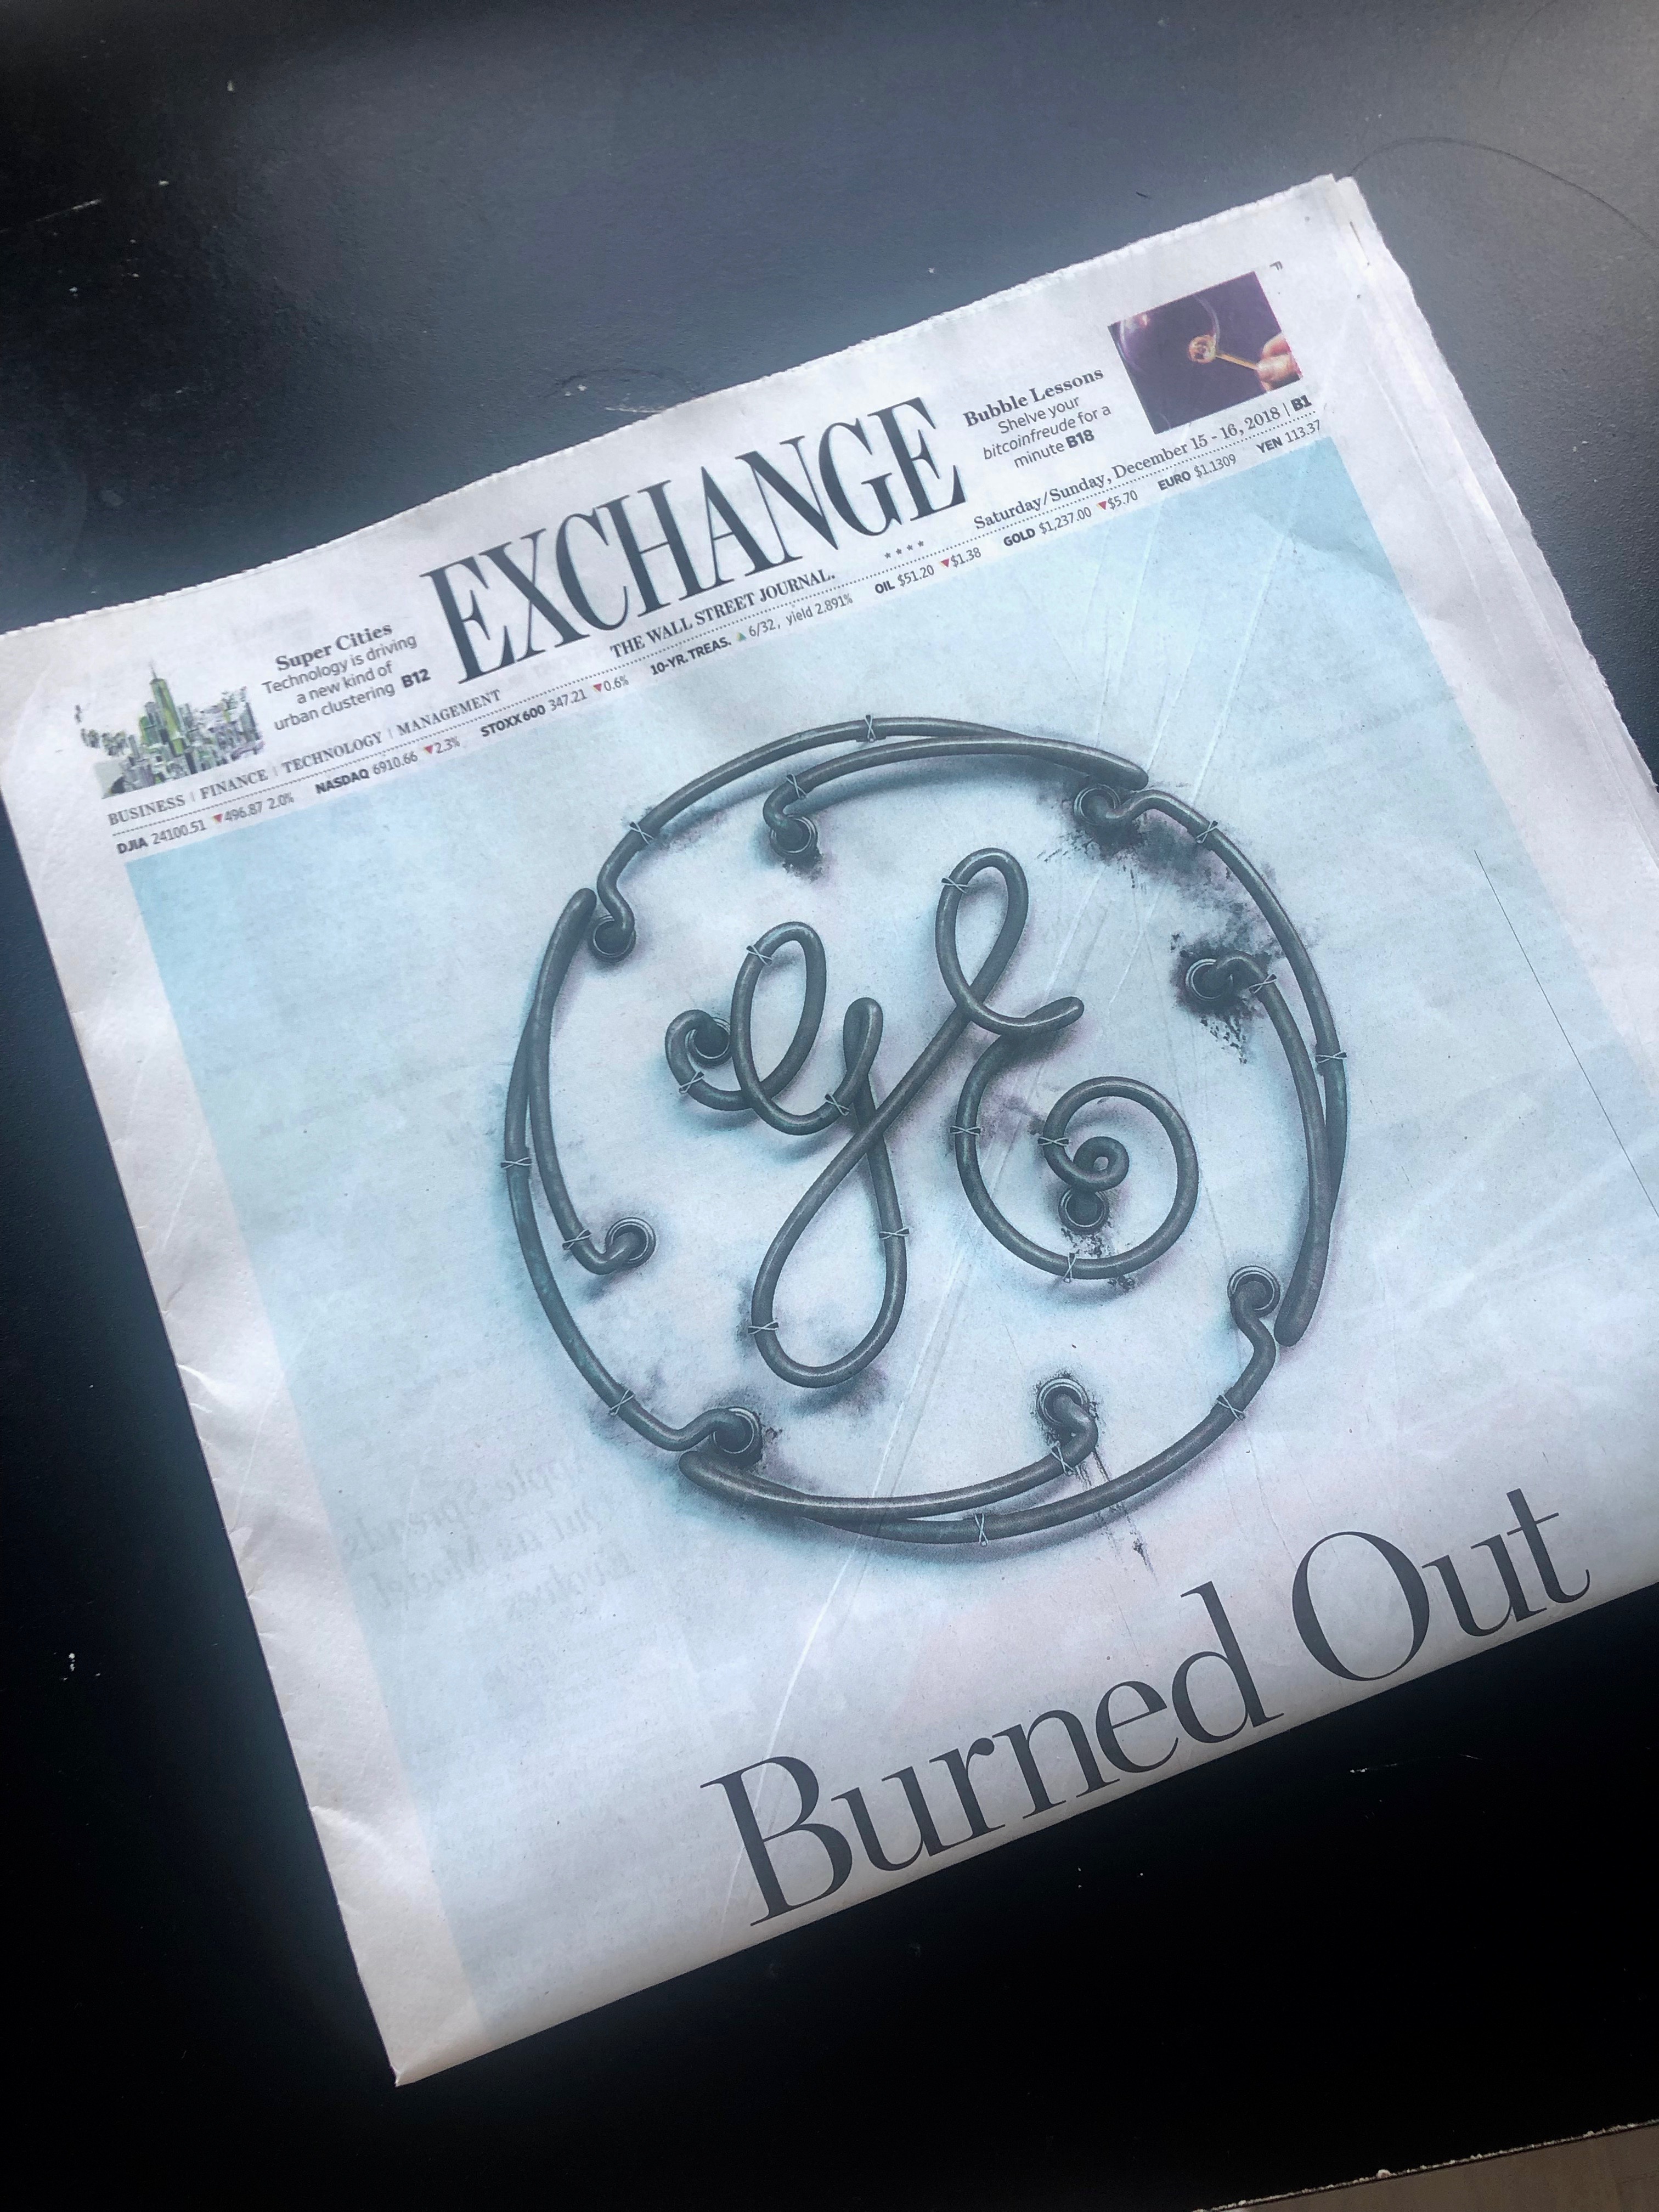
WSJ Newspaper, Dec 15-16, 2018, B1
-
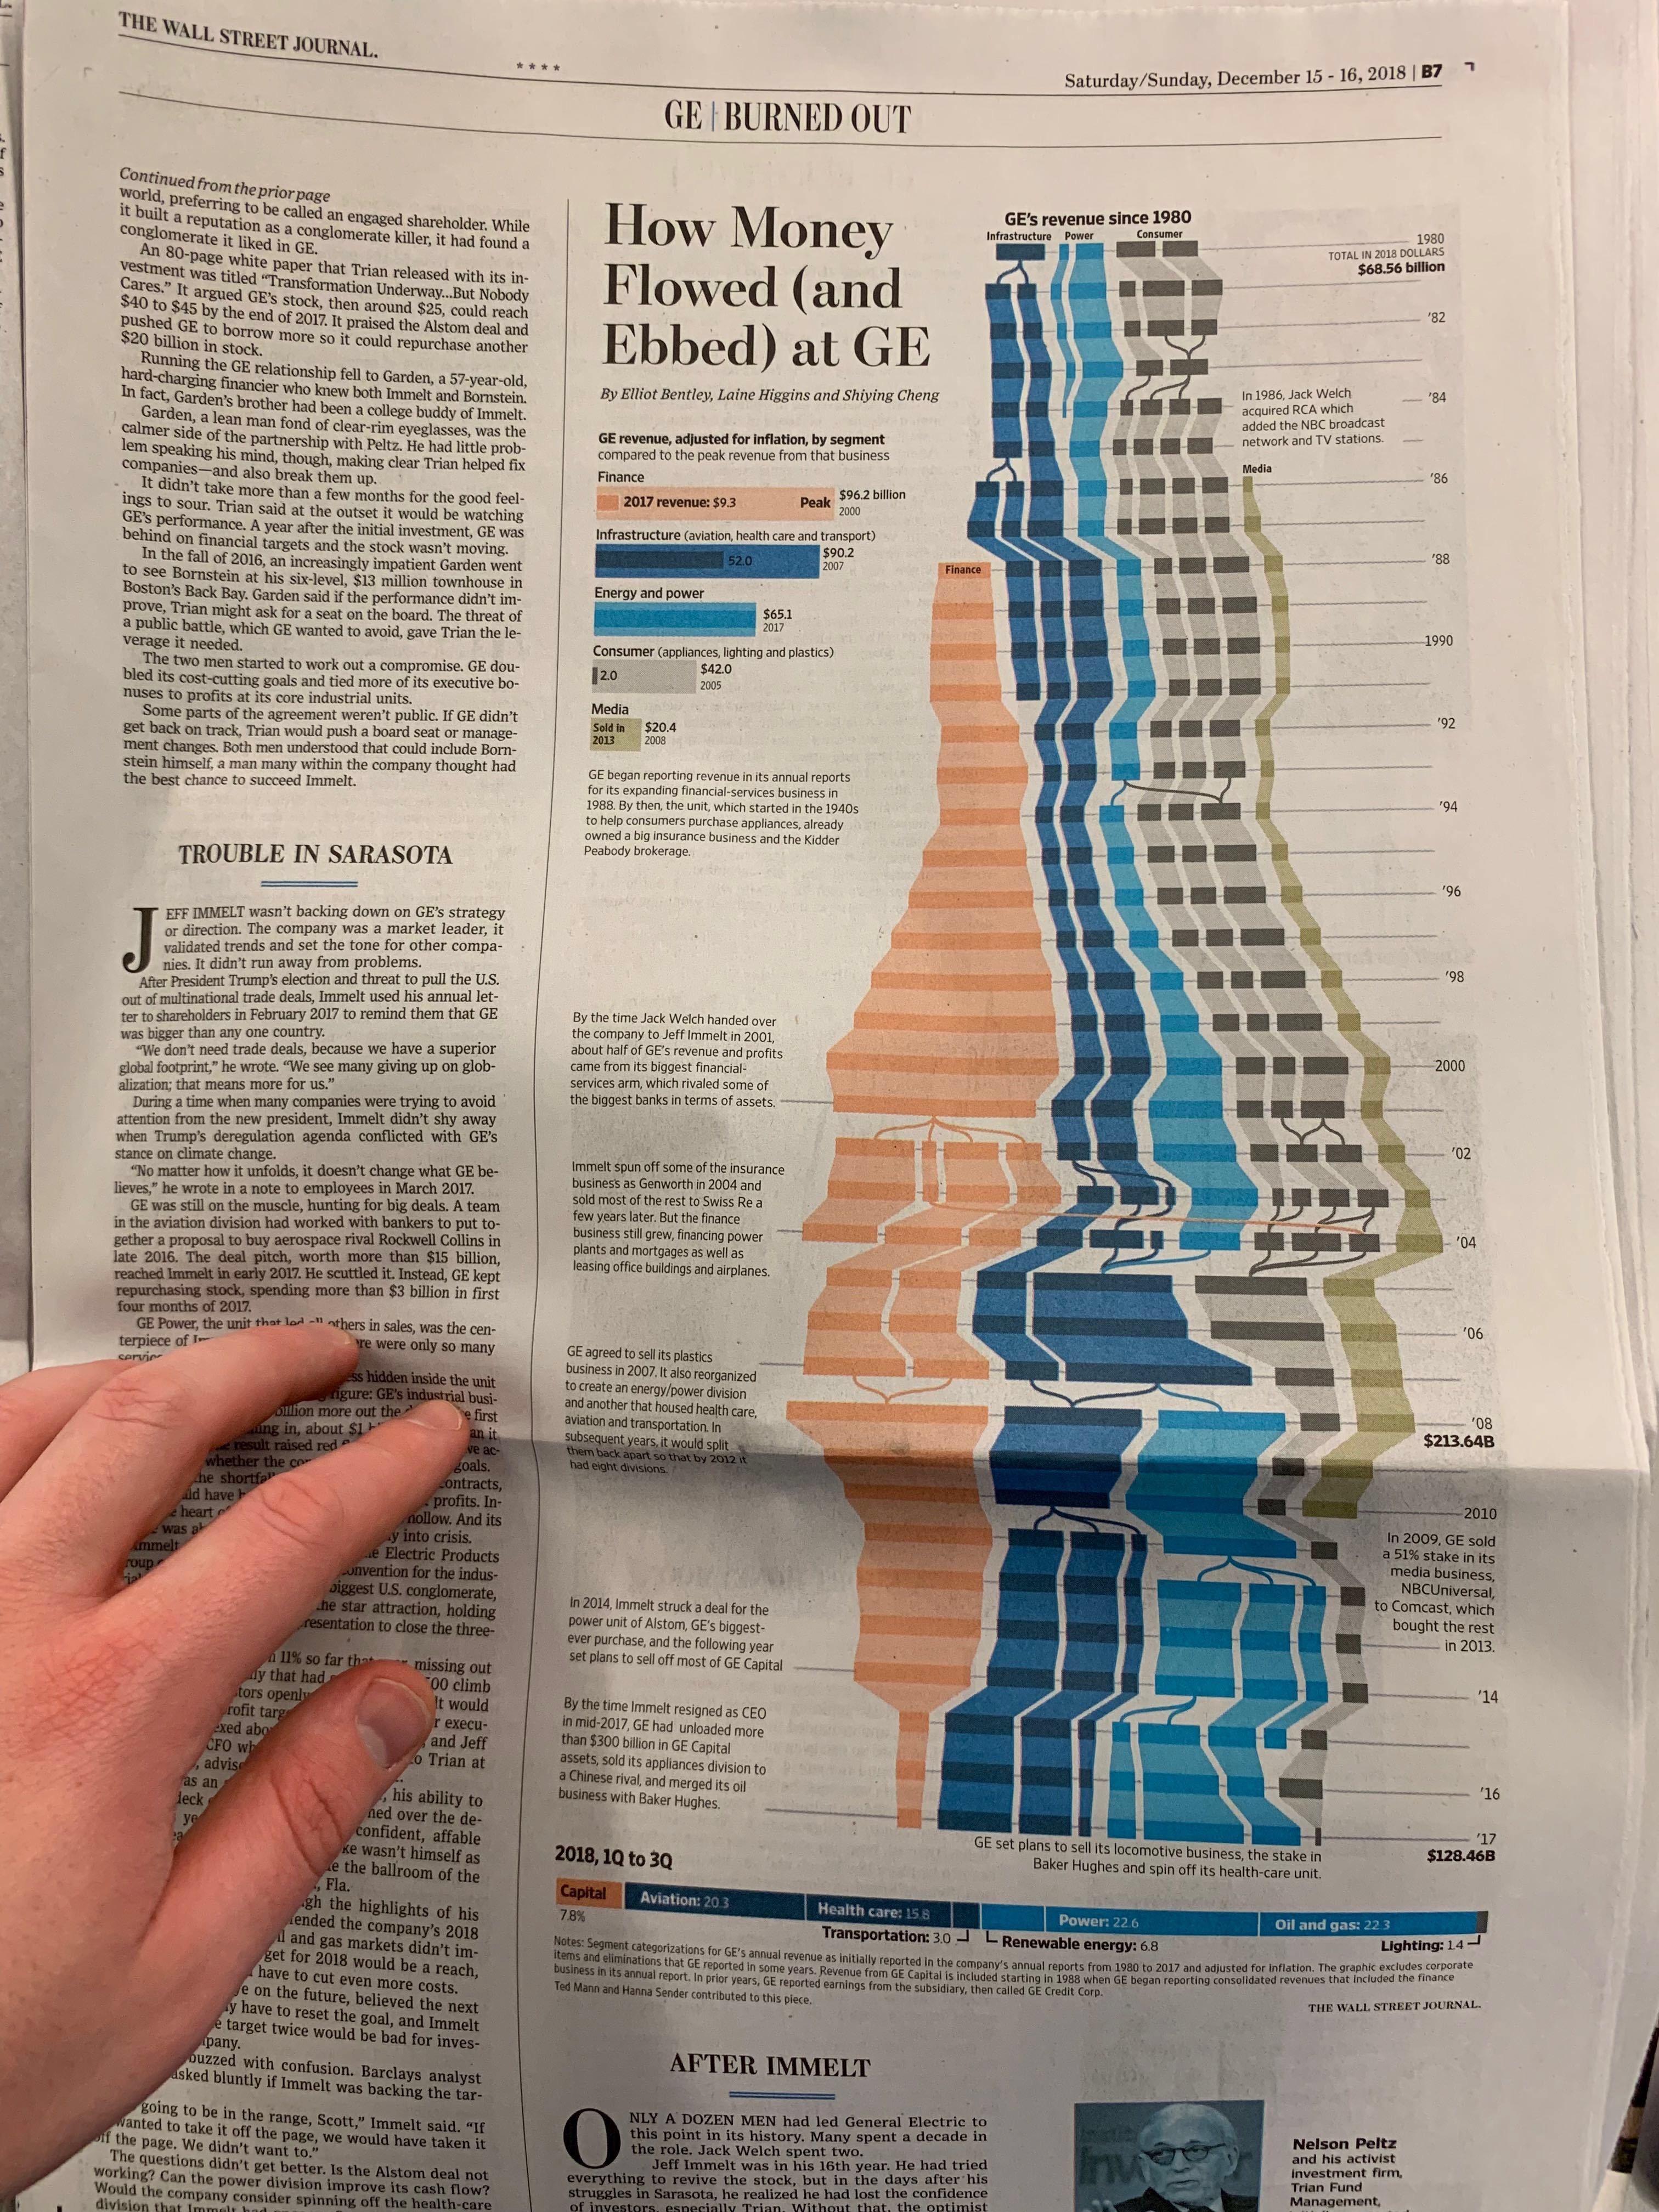
WSJ Newspaper, Dec 15-16, 2018, B7
"By the time Immelt resigned as CEO in mid-2017, GE had unloaded more than $200 billion in GE Capital assets, sold its appliances division to a Chinese rival, and merged its oil business with Baker Hughes. But the stock price was still stuck well below its peak under Welch.
Troubles surfaced in the power unit and a legacy insurance business, forcing Immelt’s successor John Flannery to break apart the conglomerate. GE set plans to sell its locomotive business and the stake in Baker Hughes and spin off its health-care unit. But additional problems in the power unit prompted the GE board in October to bring in Larry Culp as the first outsider to run GE."